Brent crude oil trading range in 2013 was narrowest since 2006
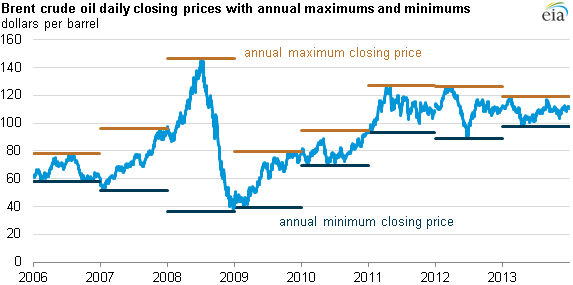
In 2013, North Sea Brent crude oil, the most important global benchmark for waterborne light sweet crude, traded in the narrowest price range since 2006 and exhibited the lowest magnitude of daily price movements in more than 10 years. The minimum closing price for 2013 was $97.69 per barrel (bbl) on April 17, and the maximum closing price was $118.90/bbl on February 8, representing a trading range of $21.21 for the year.
Historical price volatility is a measure of the magnitude of daily price movements in percentage terms over a specified period of time. It is measured by calculating the standard deviation (movement from the average) over the past 30 days of the daily percentage changes in price, and then annualizing the percentage. Market participants use measures of volatility to gauge uncertainty in factors that influence oil markets, including supply, demand, and geopolitical or macroeconomic events. For more information on how to calculate volatility, see this supplement to the Short-Term Energy Outlook.
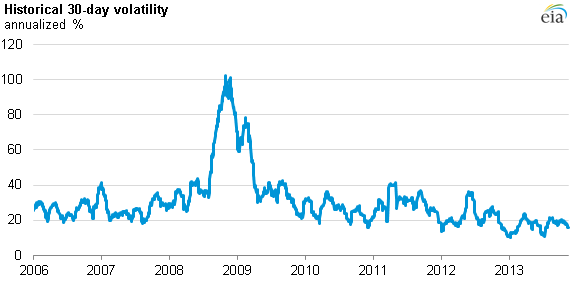
Generally speaking, periods when prices move in narrow ranges are periods of low price volatility. Historical price volatility, which reflects day-to-day percentage movements in prices, can be high when prices are rising or falling; it just depends on how stable prices are from day to day. For example, through the first half of 2007, oil prices changed at a steady rate, leading to generally low volatility despite a rise in prices.
Oil prices rose dramatically through the first half of 2008, before falling dramatically along with other asset prices in the second half of the year. Oil prices turned up again early in 2009. The large gyrations in prices, unsteady price movements, and wide annual price bands in these two years, which began with concern over global oil supply and rapid increases in emerging-market oil demand before rapidly transitioning to concerns associated with a severe global economic downturn, led to dramatically high price volatility (peaking at 102% annualized) in the fall of 2008 and to a continuation of very high levels in early 2009.
Demand-side uncertainty continued in 2010 as the European debt crisis emerged and the recovery from the economic downturn was not as robust as expected. Oil price volatility increased again in 2011, once again exceeding the 40% annualized level. Uncertainty over the Arab Spring and the Libyan supply outages, which removed as much as 1 million barrels per day from world markets, likely played a role, but volatility remained well below the levels reached during 2008 and 2009.
Price volatility in 2013 was at its lowest level over the 2006-13 period, as many of the factors that had been driving instability in oil prices were mitigated. Despite Libyan outages similar to those in 2011, Saudi Arabia maintained its production to smooth out the effects. Rising U.S. oil production also helped offset some of the losses of oil on world markets, resulting in supply being more in line with market expectations. The economic recovery became more evident as the European debt crisis waned and U.S. unemployment fell.
Principal contributor: Jeff Barron