Released: November 14, 2013
Next Release: November 20, 2013
Despite high disruption levels, rising production and lower demand restrain oil prices
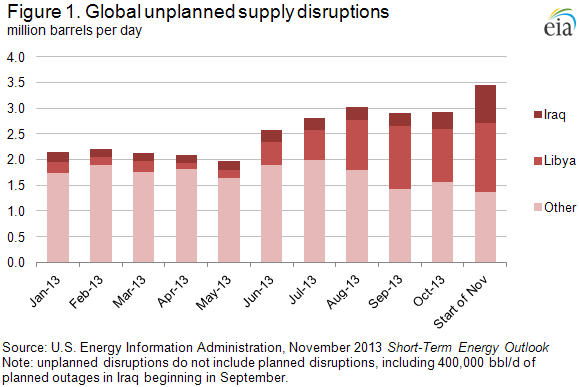
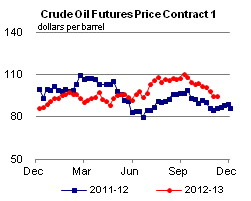
Unanticipated global petroleum supply disruptions hit a new high of more than 3 million barrels per day (bbl/d) at the start of November as the nascent recovery in Libyan production unraveled and unplanned outages reduced Iraqi supply (Figure 1). However, price increases during these supply disruptions were restrained due to a confluence of mitigating factors that included higher production in North America and Saudi Arabia, seasonally lower demand in October due to refinery maintenance, outages, and slower global economic growth. In its November Short-Term Energy Outlook, released yesterday, EIA said it expects continued growth in production, and a reduction in the level of supply disruptions, to put downward pressure on prices through the end of 2013 and into 2014. EIA expects that North Sea Brent prices will average $106 per barrel during December and $103 for all of 2014. As always, we recognize that there is significant uncertainty surrounding oil price forecasts, as reflected in the value of traded options at a wide range of strike prices.
Disruptions in Libya, where production capacity is 1.6 million bbl/d, have accounted for almost half of unplanned global outages. Libyan production is down more than 80% (1.3 million bbl/d) from its 2013 high of 1.5 million bbl/d in April and down 0.3 million bbl/d from already heavily disrupted production volumes in October. Crude oil production in Libya has been volatile as a series of political crises have caused major swings in output and exports. Production had recovered by several hundred thousand barrels per day in mid-September as local protests subsided; however, in late October, the 340,000-bbl/d El Sharara field and the 160,000-bbl/d Mellitah export terminal were shut down by demonstrations. These disruptions reduced total Libyan production to around 250,000 bbl/d and exports to less than 100,000 bbl/d.
In Iraq, planned maintenance and ongoing unplanned security-related outages have taken 740,000 bbl/d of crude oil production offline since September. The security situation in Iraq continues to affect production. The latest in a series of persistent attacks on the Kirkuk-Ceyhan pipeline between Iraq and Turkey occurred on November 2, contributing to 340,000 bbl/d of total unplanned Iraqi production outages. Planned outages, which are not included in the estimated 3 million bbl/d of global unplanned disruptions, include upgrades to southern petroleum export terminals that have reduced Iraqi crude oil output by almost 400,000 bbl/d. This production is likely to remain offline for the remainder of 2013, and possibly into 2014.
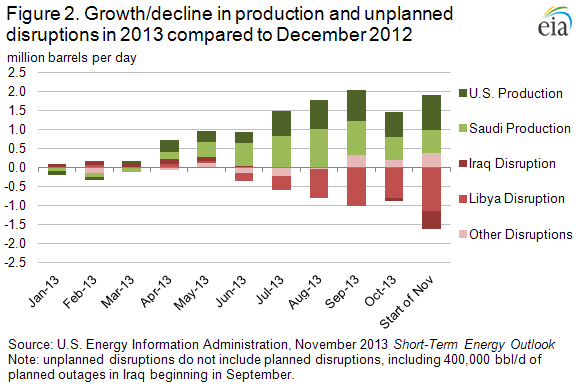
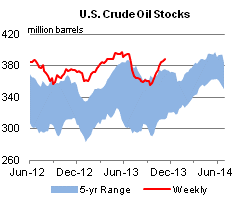
While unplanned disruptions are at their highest level since at least January 2011, new production outside the Middle East is helping supply global demand (Figure 2). EIA expects non-OPEC production to grow 1.6 million bbl/d in 2013, with 1.5 million bbl/d coming from North America, predominantly the United States. Higher U.S. production has helped reduce crude oil imports into the United States, especially imports of Nigerian light sweet crude, similar to displaced Libyan crude. The light sweet crude imports displaced from the U.S. market are now available to meet demand elsewhere. In addition to higher non-OPEC production, Saudi Arabia has maintained production around 10 million bbl/d, despite the end of its summer peak domestic demand season, helping to backfill outages in other OPEC countries. However, this increase has also reduced global spare production capacity, which averaged only 1.7 million bbl/d in the third quarter, 1.4 million bbl/d below the three-year average and the lowest level since 2008.
Supply, of course, is only one side of the oil market equation. When production levels were high this past summer, similar supply disruptions caused prices to increase in July and August, when refinery crude runs were seasonally higher. According to the International Energy Agency (IEA), global refiner crude throughput averaged 76 million bbl/d in October, down 2 million bbl/d compared to July. Refinery crude runs, especially in Europe, declined because of seasonal refinery maintenance outages.
As a result of increased North American production and continued high Saudi Arabian production coupled with slacking global oil demand, Brent spot prices fell from a September average of $112 per barrel to $109 per barrel as of November 14, despite record disruptions. In the near term, the IEA expects December world refinery throughputs to rise by 2.4 million bbl/d compared to October, which could lead to short-term price increases should disruptions worsen or Saudi production fall more than markets anticipate. Nevertheless, EIA expects continued rising global liquids production — increasing 1.5 million bbl/d in 2014 — coupled with fewer disruptions and relatively modest economic growth. EIA expects Brent crude oil prices will continue to move lower, averaging $101 per barrel by the end next year.
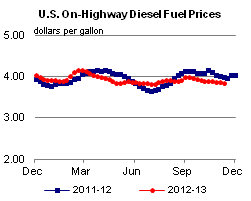
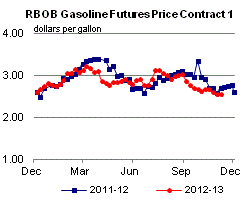
Gasoline and diesel fuel prices drop again
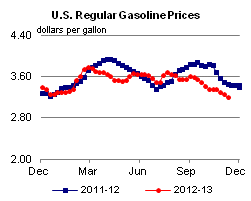
The U.S. average retail price of regular gasoline decreased seven cents to $3.19 per gallon as of November 11, 2013, 26 cents lower than last year at this time and the lowest price since February 21, 2011. Prices fell in all regions of the nation for the third consecutive week, with the largest decrease coming in the Midwest, where the price declined 11 cents to $3.07 per gallon. The Rocky Mountain price was $3.23 per gallon, eight cents lower than last week. Dropping six cents, the West Coast price was $3.51 per gallon. The Gulf and East Coast prices were a nickel lower, at $2.98 per gallon and $3.24 per gallon, respectively.
The national average diesel fuel price fell three cents to $3.83 per gallon, 15 cents lower than last year at this time. The West Coast price was below the $4 per gallon mark for the first time since July 15, 2013, at $3.98 per gallon and four cents lower than last week. The Midwest price declined three cents to $3.80 per gallon, and the East Coast, Gulf Coast, and Rocky Mountain prices all decreased two cents, to $3.86 per gallon, $3.75 per gallon, and $3.84 per gallon, respectively.
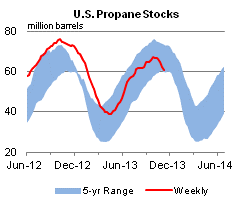
Propane stocks continue seasonal decline
Total U.S. inventories of propane decreased last week by 1.3 million barrels to end at 60.8 million barrels, 12.4 million barrels (16.9%) lower than a year ago. The Midwest region led the decline, falling by 0.8 million barrels. Gulf Coast regional stocks fell by 0.5 million barrels. East Coast and Rocky Mountain/West Coast stocks were both up slightly. Propylene non-fuel-use inventories represented 5.0% of total propane inventories.
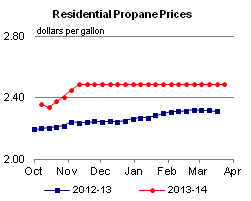
Propane prices continue to increase while heating oil prices decrease
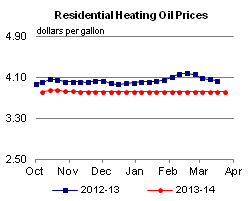
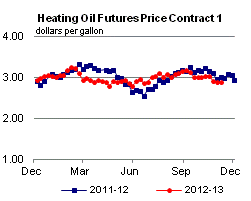
Residential heating oil prices decreased by nearly a cent per gallon last week during the period ending November 11, 2013 to reach a price just shy of $3.82 per gallon. This is 19 cents per gallon lower than the price at the same time last year. Wholesale heating oil prices decreased by 1 cent per gallon, arriving at $2.99 per gallon.
The average residential propane price increased almost 4 cents per gallon last week to reach a price just under $2.49 per gallon, nearly 25 cents per gallon higher than the same period last year. Wholesale propane prices increased by almost 2 cents per gallon to reach a price of $1.38 per gallon as of November 11, 2013.
Text from the previous editions of This Week In Petroleum is accessible through a link at the top right-hand corner of this page.
 |
 |
||||||
 |
 |
||||||
| Retail Data | Change From Last | Retail Data | Change From Last | ||||
| 11/11/13 | Week | Year | 11/11/13 | Week | Year | ||
| Gasoline | 3.194 | Heating Oil | 3.815 | ||||
| Diesel Fuel | 3.832 | Propane | 2.485 | ||||
 |
 |
||||||||||||||||||||||||||
|
 |
||||||||||||||||||||||||||
| *Note: Crude Oil Price in Dollars per Barrel. | |||||||||||||||||||||||||||
 |
 |
||||||
 |
 |
||||||
| Stocks Data | Change From Last | Stocks Data | Change From Last | ||||
| 11/08/13 | Week | Year | 11/08/13 | Week | Year | ||
| Crude Oil | 388.1 | Distillate | 117.3 | ||||
| Gasoline | 209.2 | Propane | 60.813 | ||||