U.S. crude oil production growth contributes to global oil price stability in 2013
Note: WTI denotes West Texas Intermediate crude oil.
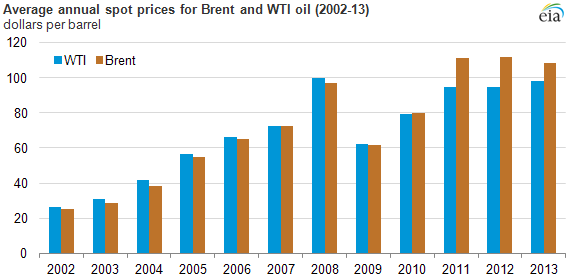
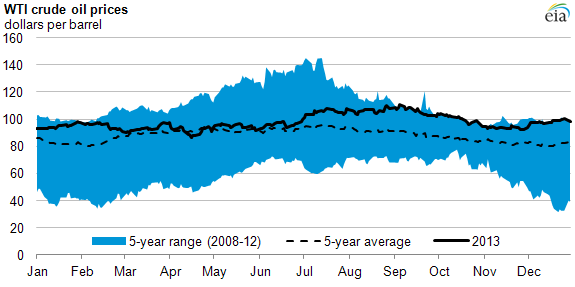
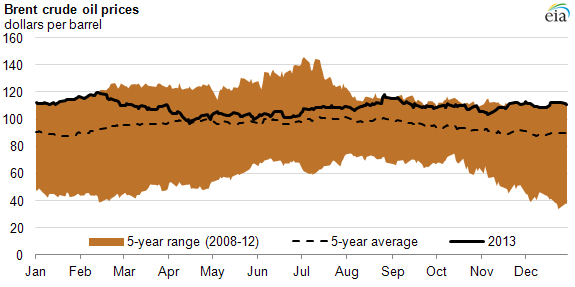
Rising crude oil production in the United States contributed to relatively stable global crude oil prices in 2013, at around the same annual average levels of the previous two years. West Texas Intermediate (WTI) spot prices averaged $98 per barrel (bbl) in 2013, up 4% from 2012 and the highest annual average since 2008. New pipeline and railroad infrastructure alleviated transportation constraints that had put downward pressure on WTI prices. The North Sea Brent spot price averaged $109/bbl, down 3% from 2012. Brent prices came under downward pressure as rising U.S. light sweet crude oil production reduced the need for U.S. imports, thereby increasing supplies of Brent-quality crude oil available to the global market.
Source: U.S. Energy Information Administration, from Bloomberg
Source: U.S. Energy Information Administration, from Bloomberg
Significant events affecting oil markets in 2013 included:
U.S. highlights
- Domestic crude oil production increased 1.0 million bbl/d—rising more than the combined increases in the rest of the world—to reach its highest level in 24 years. This increase marked the largest observed annual increase in U.S. history.
- Production exceeded imports during several weeks for the first time in nearly two decades.
- Transportation infrastructure improvements enabled crude oil from Cushing, Oklahoma, and the Bakken, Permian, and Eagle Ford tight oil formations, to better reach refineries, reducing the need for foreign crude oil.
Global highlights
- China accounted for almost one-third of growth in global demand and surpassed the United States to become the world's largest importer of crude oil.
- EIA estimates that global unplanned supply disruptions averaged 2.6 million bbl/d in 2013, 0.7 million bbl/d higher than the previous year. OPEC (Organization of the Petroleum Exporting Countries) producers had the largest volume outages at 1.8 million bbl/d.
- Despite significant production disruptions, international crude oil prices were relatively stable last year because higher U.S. production and seasonally elevated Saudi Arabian production (Saudi Arabia maintained peak summer production levels into the fall) offset outages elsewhere.
- Total liquid fuels production from members of OPEC fell by 0.9 million bbl/d in 2013. Non-OPEC liquid fuels production, concentrated in the United States, grew by more than 1.4 million bbl/d in 2013, more than offsetting the decline in OPEC production.
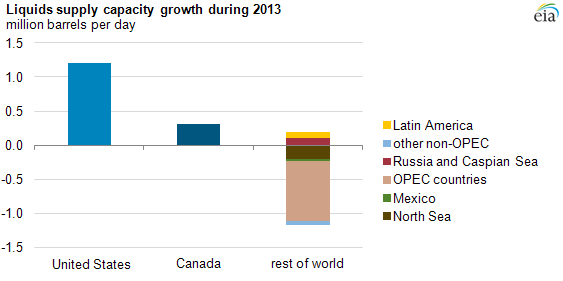
Note: Almost all countries excluding Saudi Arabia produce at full capacity. As a result, capacity and supply growth are similar for most countries.
For more information, see the January 3 edition of This Week in Petroleum.
Principal contributors: Mike Leahy, Hannah Breul