Released: April 3, 2013
Next Release: April 10, 2013
Mid-Continent Crude Oil Markets Continue to Adjust to Rapid Rise in Bakken Production
The differential between West Texas Intermediate (WTI) and North Dakota's Bakken crudes continues to fluctuate, reflecting both production growth and changes in oil transportation capacity. Bakken crude sold at a $25-per-barrel discount to WTI in early 2012 and rose to a $5-per-barrel premium last September, before again being discounted below WTI this winter. So far this year, the gap between Bakken and WTI prices has narrowed, and once again, the Bakken price has risen above the WTI price, albeit modestly (Figure 1).
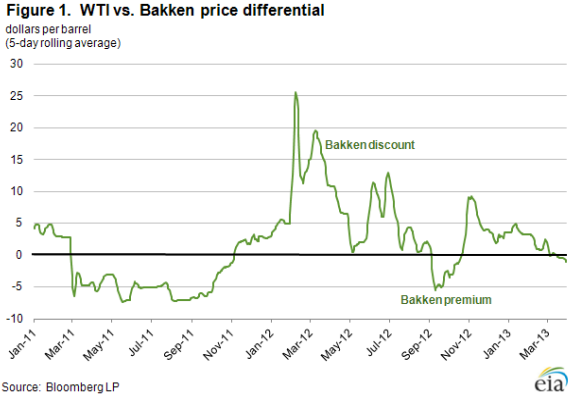
West Texas Intermediate prices are determined at Cushing, Oklahoma; Bakken prices are those at Clearbrook, Minnesota, where the North Dakota pipeline network joins Enbridge's pipeline running southeast from western Canada. Because of the costs of transporting Bakken crude to Clearbrook, including the pipeline tariff, the price for Bakken at the wellhead will be less than the delivered price at Clearbrook.
The strong growth in Bakken production has frequently outpaced expansion of the local transportation infrastructure, leading to discounts for Bakken crude compared to benchmark WTI. Production in North Dakota, the primary source of Bakken crude, rose 243,000 barrels per day (bbl/d), or 58 percent, in 2012 to 663,000 bbl/d, placing North Dakota second only to Texas in oil production among all states. Meanwhile, pipeline capacity out of the region, which is also used to accommodate increased production of Canadian crude flowing through the region, was estimated at only 395,000 bbl/d in 2012.
Limited pipeline capacity has forced shippers of Bakken crude to use alternative transportation, such as railroads. According to the North Dakota Pipeline Authority, loading capacity at North Dakota rail terminals increased by 660,000 bbl/d between 2007 and the end of 2012, with an additional 355,000 bbl/d of capacity expected to come on line by the end of 2014.
Although transportation of crude oil by rail is generally more expensive than shipping by pipeline, rail-loading capacity has proven cheaper and quicker to build. In addition, the logistical flexibility of rail has enabled Bakken crude to reach refining areas not typically served by pipeline from the Bakken. Historically, crude oil production from the Northern Plains has been discounted against midcontinent crudes to account for the added costs of moving these crudes by pipeline to areas such as Cushing, Oklahoma, and the Gulf Coast (PAD District 3).
Investment in rail offloading capacity at East Coast refineries, such as Philadelphia Energy Solutions's Philadelphia complex, suggests that Bakken offers a cost-competitive alternative to Brent-linked crude imports despite the cost of transporting Bakken by rail from the Midwest. The landed cost of Nigerian crude, the leading source of East Coast imports for most of the past two decades, averaged about $117/bbl in 2012, making Bakken and other domestic crudes economical alternatives. Because of the closure of several East Coast refineries and the availability of cheaper domestic light crude, East Coast imports of Nigerian crude fell from 471,000 bbl/d in 2005 to 166,000 bbl/d in 2012.
For West Coast refineries, cost-competitive access to Bakken crude would allow the Bakken oil to displace more-expensive imports there, as well. West Coast imports, which come primarily from Saudi Arabia, Ecuador, and Iraq, have remained flat since 2006; however, Anacortes, Washington, began receiving unit-train shipments of Bakken in late 2012, potentially signaling new competition for West Coast oil imports.
As Bakken rail shipments reach the East and West coasts, pricing for Bakken crude oil is evolving. The ability to economically reach refineries on the East and West coasts expands the market for Bakken beyond the traditional Midwest and Gulf Coast refineries, which have experienced a glut of midcontinent crudes in recent years. By moving east and west, Bakken escapes the infrastructure constraints that have significantly affected the price of WTI. The Gulf Coast, where Brent-linked imports have already declined significantly, offers less opportunity for Bakken. As light-sweet imports continue to be displaced along the Gulf Coast, Bakken will increasingly compete with other domestic crudes, many of which have lower pipeline transportation costs to the Gulf Coast. As long as Bakken production and transportation capacity scramble to seek equilibrium, continued variation in the differential between Bakken and WTI prices is likely.
Gasoline and diesel fuel prices continue to decrease
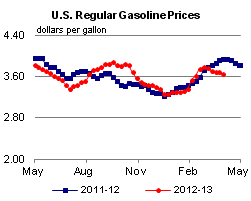
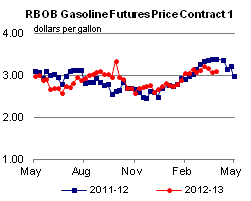
The U.S. average retail price of regular gasoline decreased four cents from the previous week to $3.65 per gallon as of April 1, 2013, down 30 cents from last year at this time. The U.S. average price has declined 14 cents over the last five weeks. Prices were lower in all regions of the nation except the Rocky Mountains, where the price is $3.50 per gallon, up three cents from last week. The largest decrease came in the Midwest, where the price dropped six cents to $3.60 per gallon. The East and Gulf Coast prices are both lower by three cents, to $3.63 per gallon and $3.48 per gallon, respectively. Rounding out the regions, the West Coast price is $3.95 per gallon, a decline of two cents.
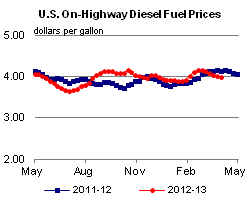
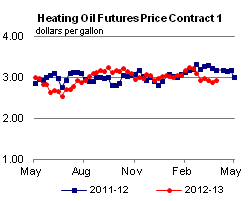
The national average diesel fuel price decreased one cent to $3.99 per gallon, 15 cents lower than last year at this time. The U.S. average price has decreased 17 cents over the last five weeks. Prices decreased in all regions of the nation except the West Coast, where the price increased two cents to $4.12 per gallon. The largest decrease came on the East Coast, where the price declined three cents to $4.03 per gallon. The Gulf Coast price is $3.92 per gallon, a drop of two cents. The Midwest and Rocky Mountain prices are both lower by a penny, to $3.97 per gallon and $3.92 per gallon, respectively.
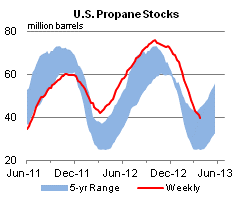
Propane inventories decline
U.S. propane stocks fell 1.1 million barrels to end at 39.7 million barrels last week, and are 5.0 million barrels (11.3 percent) lower than the same period a year ago. Gulf Coast inventories dropped by 0.6 million barrels, and Midwest regional inventories declined by 0.4 million barrels. East Coast stocks dropped by 0.1 million barrels, while Rocky Mountain/West Coast inventories decreased slightly. Propylene non-fuel-use inventories represented 9.1 percent of total propane inventories.
Text from the previous editions of This Week In Petroleum is accessible through a link at the top right-hand corner of this page.
 |
 |
||||||
| Retail Data | Change From Last | Retail Data | Change From Last | ||||
| 04/01/13 | Week | Year | 04/01/13 | Week | Year | ||
| Gasoline | 3.645 | Diesel Fuel | 3.993 | ||||
 |
 |
||||||||||||||||||||||||||
|
 |
||||||||||||||||||||||||||
| *Note: Crude Oil Price in Dollars per Barrel. | |||||||||||||||||||||||||||
 |
 |
||||||
 |
 |
||||||
| Stocks Data | Change From Last | Stocks Data | Change From Last | ||||
| 03/29/13 | Week | Year | 03/29/13 | Week | Year | ||
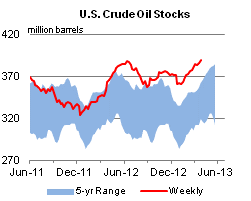
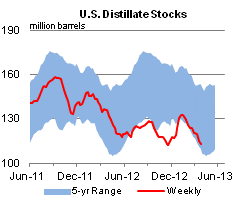
| Crude Oil | 388.6 | Distillate | 113.0 | ||||
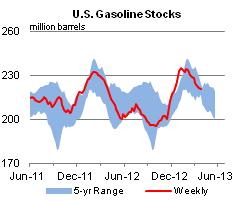
| Gasoline | 220.7 | Propane | 39.737 | ||||