Stretches of Upper Mississippi River near record-low levels
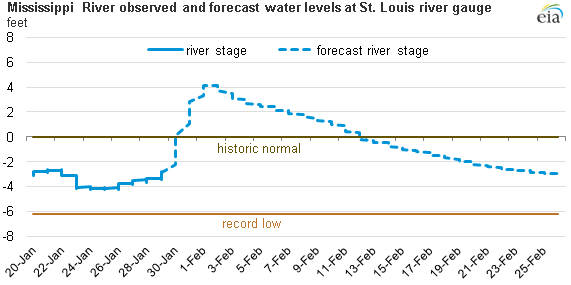
Note: Forecast as of 5:00 p.m. EST, January 29, 2013 based on current rainfall projections. A river stage of zero would be considered near the historic normal for that river gauge, while flood stage is declared at a river stage of 30 feet.
Republished January 30, 2013, 4 p.m.: Text was modified to clarify content. The third graph was added.
As a result of last year's drought, stretches of the Upper Mississippi River have approached record lows. These low water levels have jeopardized commercial barge traffic shipping agricultural and energy commodities on the river. Recent rock blasting and dredging by the U.S. Army Corps of Engineers and rainfall in the near-term forecast are expected to provide some relief. Key energy commodities transported via Mississippi River barges are coal and, increasingly, crude oil and distillate fuel oil.
Large stretches of the Upper Mississippi have seen low water levels, although for the most part the Lower Mississippi River Basin (after the confluence of the Ohio and Mississippi rivers, near the Missouri, Illinois, and Kentucky borders) has remained at normal water levels. When levels start to drop below certain points, barge traffic is slowed because of congestion in the narrower portion of the river that remains navigable.
Crude Oil and Petroleum Products
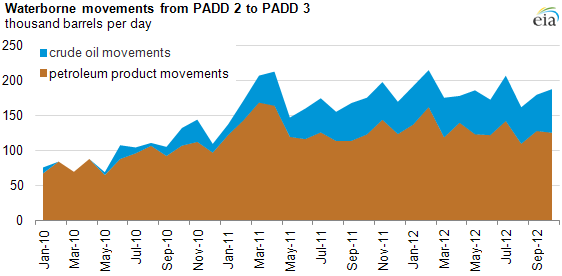
The Mississippi River has long been an important waterway for U.S. commerce, including movement of crude oil and petroleum products. Crude oil movements by barge and tanker between the Midwest (PADD 2) and Gulf Coast (PADD 3) in both directions averaged 55,000 barrels per day (bbl/d) during January through October 2012, up 14,000 bbl/d from the same period last year while petroleum product movements, including fuel ethanol, were down 11,000 bbl/d to 182,000 bbl/d.
In 2007, only 5,000 bbl/d of crude and 71,000 bbl/d of petroleum products moved on tankers and barges from PADD 2 to PADD 3. By 2010, the volumes moved from PADD 2 to PADD 3 increased to 11,000 bbl/d of crude and 89,000 bbl/d of petroleum products. In 2011 and 2012, waterborne shipments were driven by crude oil movements as production of crude oil in PADD 2 outpaced pipeline capacity growth and producers looked for alternative ways to move growing crude oil volumes to refining centers on the U.S. Gulf Coast. The January 16 edition of This Week In Petroleum included a detailed analysis of crude oil shipments from PADD 2 to PADD 3.
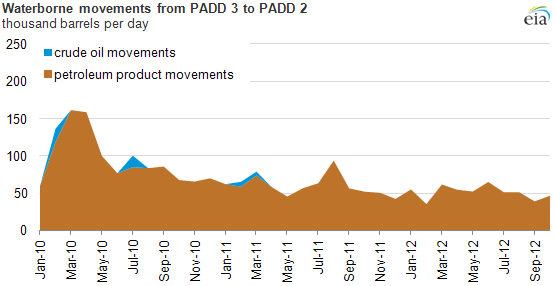
Waterborne movements in the opposite direction, from the Gulf Coast to the Midwest, consist mostly of petroleum products. Waterborne movement of crude oil from PADD 3 to PADD 2 was seen in only four months between January 2010 and October 2012. In general, after peaking at 162,000 bbl/d in March 2010, volumes of waterborne petroleum products moving north, mostly on the Mississippi River, have been declining.
Coal
Barge traffic is highly ranked (behind rail) as the most frequent transport mode for coal headed to electric power plants in the United States. The Mississippi River also is a key transport mode for coal being delivered to export terminals in New Orleans.
As with flooding in the spring of 2011, the disruptions in barge traffic have not had a material effect on coal supplies at electric power plants yet. Stockpiles of coal at electric power plants remain elevated because of increased competition between natural gas and coal for power generation as well as a warm winter, providing ample supply of coal at electric power plants.