Released: January 16, 2013
Next Release: January 24, 2013
Upcoming Pipeline Capacity Additions Will Facilitate Continued Growth in Crude Oil Shipments from Midwest to Gulf Coast
Continuing growth in U.S. crude oil production is causing significant changes in the way crude oil moves within the United States. The Midwest (PADD 2) has been one of the major sources of this production growth, especially from the Bakken formation in North Dakota. Pipeline flows from PADD 2 to PADD 3 will increase over the next two years as several major pipeline projects, starting with the Seaway Pipeline's current capacity expansion, are completed.
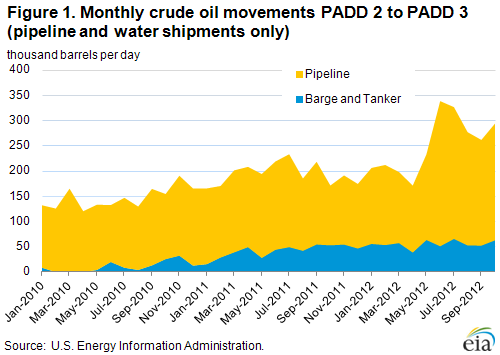
As PADD 2 crude oil production has rapidly increased, pipeline capacity to move crude oil out of PADD 2 to refineries in other regions, particularly to the major refining centers on the U.S. Gulf Coast in PADD 3, has become highly constrained. While crude oil shipped on pipelines from PADD 2 to PADD 3 has increased sharply in recent years (Figure 1), capacity additions have not been able to keep up with production increases. Thus, pipeline capacity constraints have led to regional differences in crude oil prices within the United States, as modes of transportation that can be put into service more quickly than pipelines are being used to move marginal crude oil production. These modes of transportation include railroads, trucks, barges, and tankers.
The growth in crude oil shipments by rail has been particularly noteworthy. The Energy Information Administration (EIA) does not yet collect data on rail shipments — therefore they are not included in Figure 1 — but other sources suggest total rail shipments of crude oil from the Bakken formation grew from 170,000 barrels per day (bbl/d) in January of 2012 to about 425,000 bbl/d by October 2012. Although shipments are increasingly being directed to the East and West Coasts, the majority went to PADD 3 refiners.
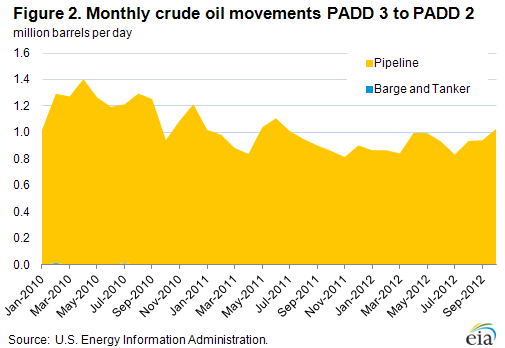
Before the recent growth in crude oil production in the United States, the pipeline system was configured to deliver both crude oil imported to the U.S. Gulf Coast and domestic production from West Texas to the refineries in PADD 2, via Cushing, Oklahoma (the delivery point for the light sweet crude oil futures contract traded on the New York Mercantile Exchange). In 1999, almost 2.1 million bbl/d of crude oil was shipped from PADD 3 to PADD 2, all by pipeline. Through the first 10 months of 2012, that number had fallen 1.1 million bbl/d to an average of 927,000 bbl/d (Figure 2). Based on press reports, a portion of this decrease is likely the result of reduced shipments on the Capline Pipeline, which runs north from the U.S. Gulf Coast through Memphis, Tennessee, and on to Patoka, Illinois. The decrease in volume has been partially offset by growing volumes of crude oil shipped to PADD 2 on pipelines running from West Texas, including pipelines running from the Permian Basin, where production is rising, to the Cushing area. EIA includes West Texas production in PADD 3 data, but West Texas lacks sufficient pipeline connections to major refining centers in PADD 3 along the Texas and Louisiana coasts.
Given the growth in PADD 2 crude oil production, crude oil is increasingly moving south. In 2010, just 147,000 bbl/d of crude oil was shipped from the Midwest to the Gulf Coast. Through October 2012, that number had increased to 252,000 bbl/d. The May 2012 reversal of the Seaway Pipeline contributed most of this increase, adding 150,000 bbl/d of pipeline capacity from PADD 2 to PADD 3.
Notwithstanding the increases, pipeline capacity has not been able to keep up with production growth. PADD 2 crude oil production in 2012 (through October) was almost 1.1 million bbl/d, up from 436,000 bbl/d in 2004. Moreover, production growth in West Texas's Permian Basin is linked by pipeline to PADD 2 markets in Cushing and the surrounding refineries. Along with PADD 2's growing production, these shipments have increased the congestion at Cushing. In an effort to avoid the lower-priced Cushing area, growing Permian Basin production is encouraging intra-PADD shipments from there to the refining centers along the Gulf Coast.
Given the significant time required to reverse or construct pipelines, market participants are increasing shipments on rail, the next most economic choice, from PADD 2 to PADD 3, and even farther to markets on the East and West Coasts. However, as previously mentioned, EIA does not track petroleum movements by rail.
Barges and tankers are additional modes of transportation moving crude oil from PADD 2 to PADD 3. Through October 2012, 55,000 bbl/d of crude oil was shipped on tankers and barges from PADD 2 to PADD 3, up from less than 10,000 bbl/d during the same period in 2010. While EIA does not record routes traveled, the trade press reports Bakken crude oil arriving in Missouri via rail and being barged down the Mississippi River. Other reports have noted trucks moving crude oil from Cushing to the Arkansas River and then to the Mississippi River and south to Louisiana.
Looking forward, it is likely pipeline flows from PADD 2 to PADD 3 will increase in the coming months. Early this year, Enterprise Products Partners LP and Enbridge Inc. announced that the Seaway Pipeline's capacity expansion project, which will increase pipeline capacity from Cushing to the Houston area by 250,000 bbl/d, was nearing completion. Another notable project expected to add Cushing-to-Gulf-Coast capacity is TransCanada's Gulf Coast Pipeline project, which began construction in August 2012 and is expected to be completed in mid-to-late 2013 with an initial capacity of 700,000 bbl/d. Additionally, the Seaway Pipeline is expected to be twinned, increasing its capacity to 850,000 bbl/d in early 2014.
Gasoline price inches up, diesel fuel price down
The U.S. average retail price of regular gasoline increased less than a penny for a second consecutive week to remain at $3.30 per gallon, down nine cents from last year at this time. The East Coast and Midwest prices both increased a penny, to $3.45 per gallon and $3.16 per gallon, respectively. The Gulf Coast and West Coast prices both changed less than a cent, to remain at $3.17 per gallon and $3.49 per gallon, respectively. The Rocky Mountain price is the lowest in the nation for the third consecutive week, and had the largest decrease, falling seven cents to $2.87 per gallon.
The national average diesel fuel price decreased two cents to $3.89 per gallon, four cents higher than last year at this time. Prices decreased in all regions of the nation except the West Coast, where the price remained unchanged at $3.99 per gallon. The largest decrease came in the Midwest, where the price decreased four cents to $3.83 per gallon. The Rocky Mountain price is now $3.66 per gallon, a decrease of three cents from last week, and the Gulf Coast price decreased a penny to $3.82 per gallon. Rounding out the regions, the East Coast price is $4.00 per gallon, a decrease of less than a cent from last week.
Propane inventories decline
U.S. propane stocks fell 1.6 million barrels to end at 64.0 million barrels last week, 10.7 million barrels (20 percent) higher than a year ago. Midwest regional inventories dropped by 1.1 million barrels, while East Coast inventories declined by 0.5 million barrels. Rocky Mountain/West Coast stocks dropped by 0.4 million barrels, and the Gulf Coast region gained by 0.5 million barrels. Propylene non-fuel-use inventories represented 5.1 percent of total propane inventories.
Residential heating fuel prices stay flat
Residential heating oil prices were unchanged from January 7, 2013 to January 14, 2013. The average residential heating oil price held at $3.97 per gallon, 2 cents per gallon higher than the same time last year. Wholesale heating oil prices remained at $3.14 per gallon, more than 2 cents per gallon higher than last year at this time.
The average residential propane price rose a fraction of a cent, holding steady at $2.43 per gallon, 43 cents per gallon lower than the same period last year. Wholesale propane prices decreased by nearly 3 cents to $0.89 per gallon for the week ending January 14, 2013, 31 cents per gallon lower than the January 16, 2012 price.
 |
 |
||||||
 |
 |
||||||
| Retail Data | Change From Last | Retail Data | Change From Last | ||||
| 01/14/13 | Week | Year | 01/14/13 | Week | Year | ||
| Gasoline | 3.303 | Heating Oil | 3.973 | ||||
| Diesel Fuel | 3.894 | Propane | 2.434 | ||||
 |
 |
||||||||||||||||||||||||||
|
 |
||||||||||||||||||||||||||
| *Note: Crude Oil Price in Dollars per Barrel. | |||||||||||||||||||||||||||
 |
 |
||||||
 |
 |
||||||
| Stocks Data | Change From Last | Stocks Data | Change From Last | ||||
| 01/11/13 | Week | Year | 01/11/13 | Week | Year | ||
| Crude Oil | 360.3 | Distillate | 132.4 | ||||
| Gasoline | 235.0 | Propane | 63.956 | ||||