In the News:
IEnova completes construction on two pipelines bringing Permian gas into Mexico
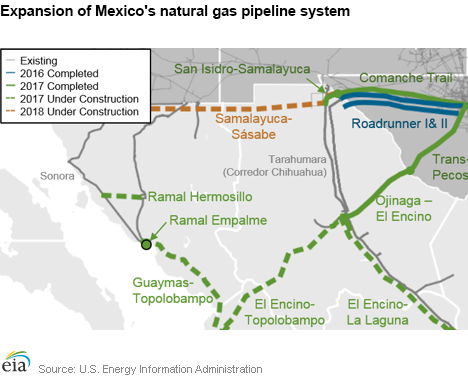
Two new natural gas pipelines have recently been put into service that will transport natural gas produced from the Permian basin to expanding demand markets in Mexico. When down-stream infrastructure projects are completed, they are expected to contribute to continued growth of U.S exports of natural gas to Mexico.
The San Isidro-Samalayuca pipeline (15 miles, 1,135 million cubic feet per day (MMcf/d)) was completed in May and the Ojinaga- El Encino pipeline (127 miles, 1,350 MMcf/d) was completed in June as reported via Genscape and confirmed by IEnova’s parent company, Sempra Energy. These infrastructure projects are part of Mexico’s Secretaría de Energía’s (SENER) ongoing energy market reforms to expand the natural gas pipeline network and add electric power generation capacity, allowing for more competitive pricing and the use of cleaner fuels.
The San Isidro-Samalayuca pipeline connects with the recently completed Comanche Trail pipeline at the border in San Elizario, Texas. In addition to transporting natural gas to the 906 megawatt (MW) Norte III combined cycle power plant (currently under construction and expected to be completed in November 2017), the pipeline will also connect with the operational Tarahumara (“Corredor Chihuahua”) pipeline (237 miles, 850 MMcf/d), which extends from El Paso, Texas to north-central Mexico, and the Samalayuca-Sásabe pipeline (404 miles, 472 MMcf/d), which is expected to go into service in 2018.
The Ojinaga- El Encino pipeline is supplied by the newly completed Trans-Pecos Pipeline at the Mexican border in Presidio, Texas. It is designed to bring natural gas south to El Encino where it connects to several other pipelines that extend further south and west into Mexico. These projects are still under construction and are not expected to be in service until later in 2017. As a result, flows on the Ojinaga-El Encino pipeline are expected to be minimal until these projects are completed later this year.
In addition to these two projects, IEnova also completed construction in June on the Ramal Empalme pipeline, a 12-mile, 226 MMcf/d branch off the existing Sonora pipeline that brings gas south from Arizona into northwestern Mexico. However, this pipeline is not expected to see significant flows until construction is completed on two new combined cycle plants, the 770 MW Empalme I and the 791 MW Empalme II. These plants, which are expected to come online in November 2017 and mid-2018, respectively, will be publicly owned and operated by the Comisión Federal De Electricidad (CFE) in Mexico.
Overview:
(For the Week Ending Wednesday, June 28, 2017)
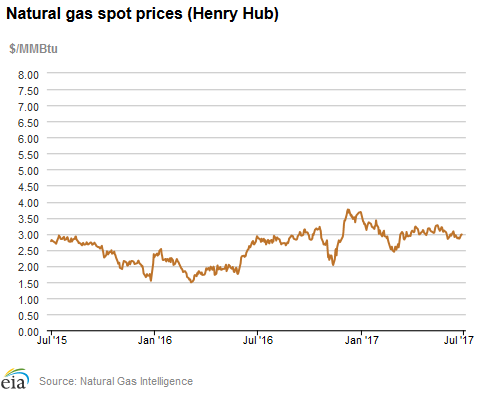
- Natural gas spot price movements were mixed this report week (Wednesday, June 21 to Wednesday, June 28). The Henry Hub spot price rose from $2.88 per million British thermal units (MMBtu) last Wednesday to $3.01/MMBtu yesterday.
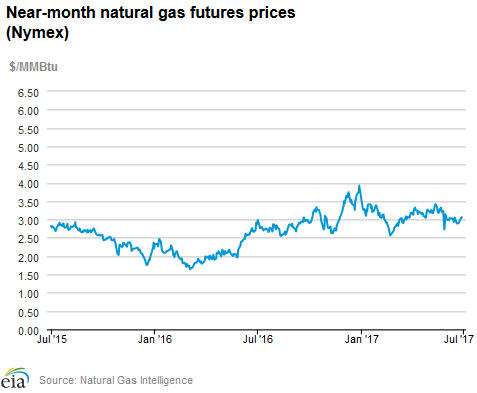
- At the New York Mercantile Exchange (Nymex), the July 2017 contract expired yesterday at $3.067/MMBtu. The August 2017 contract price increased to $3.094/MMBtu, up 18¢ Wednesday to Wednesday.
- Net injections to working gas totaled 46 billion cubic feet (Bcf) for the week ending June 23. Working natural gas stocks are 2,816 Bcf, which is 10% less than the year-ago level and 7% more than the five-year (2012–16) average for this week.
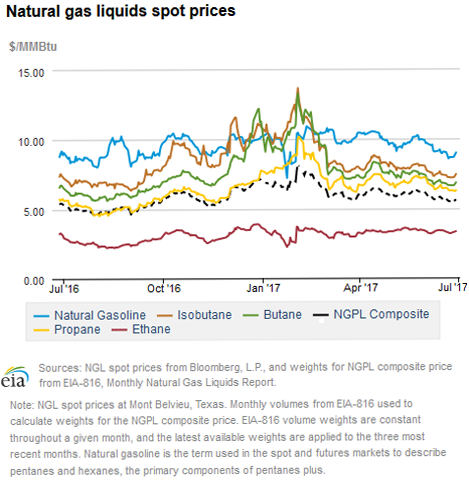
- The natural gas plant liquids composite price at Mont Belvieu, Texas, fell by 9¢, averaging $5.55/MMBtu for the week ending June 28. The prices of natural gasoline, ethane, and isobutane all fell by 1%, and the prices of propane and butane fell by 2%
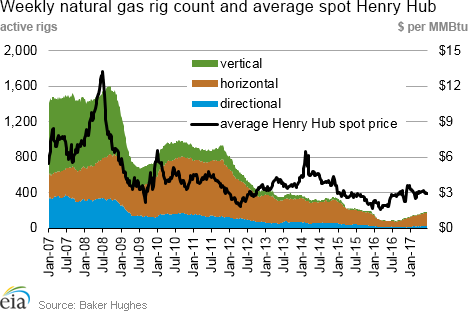
- According to Baker Hughes, for the week ending Friday, June 23, the natural gas rig count decreased by 3 to 183. The number of oil-directed rigs rose by 11 to 758. The total rig count increased by 8, and it now stands at 941.
Prices/Supply/Demand:
Spot price changes are mixed. This report week (Wednesday, June 21 to Wednesday, June 28), the Henry Hub spot price rose 13¢ from $2.88/MMBtu last Wednesday to $3.01/MMBtu yesterday. At the Chicago Citygate, prices increased 4¢ from $2.80/MMBtu last Wednesday to $2.84/MMBtu yesterday. Prices at PG&E Citygate in Northern California stayed level week over week at $3.19/MMBtu. The price at SoCal Citygate decreased 91¢ from $3.99/MMBtu last Wednesday to $3.08/MMBtu yesterday, as a regional heatwave dissipated going into last weekend.
Northeast prices see some volatility. At the Algonquin Citygate, which serves Boston-area consumers, prices went down 14¢ from $2.85/MMBtu last Wednesday to $2.71/MMBtu yesterday, after a week of up-and-down price movements. Algonquin prices went as high as $2.99/MMBtu last Thursday, and as low as $2.17 on Monday as cooler weather took hold. At the Transcontinental Pipeline Zone 6 trading point for New York, prices increased 20¢ from $2.36/MMBtu last Wednesday to $2.56/MMBtu yesterday. Like Algonquin, New York had up-and-down price movements during the week.
Tennessee Zone 4 Marcellus spot prices increased 22¢ from $1.70/MMBtu last Wednesday to $1.92/MMBtu yesterday. Prices at Dominion South in northwest Pennsylvania rose 11¢ from $1.83/MMBtu last Wednesday to $1.94/MMBtu yesterday.
Price of August contract rises; July contract expires. At the Nymex, the July 2017 contract expired yesterday at $3.067/MMBtu, up 17¢ from last Wednesday. The August 2017 contract increased to $3.094/MMBtu, up 18¢ from last Wednesday to yesterday. The price of the 12-month strip averaging August 2017 through July 2018 futures contracts climbed 11¢ to $3.113/MMBtu.
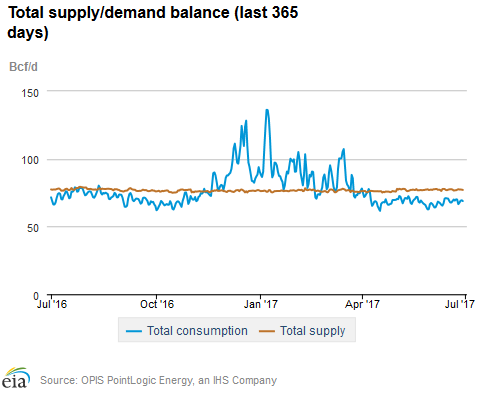
Supply remains flat. According to data from PointLogic, the average total supply of natural gas remained the same as the previous report week, averaging 77.2 Bcf/d. Dry natural gas production also remained constant week over week. Average net imports from Canada decreased by 5% from last week, but had a negligible effect on overall supply.
Demand falls. Total U.S. consumption of natural gas fell by 1% compared with the previous report week, according to data from PointLogic. Power burn declined by 4% week over week as a heatwave in the Southwest dissipated and a system of cooler weather moved across the Central and Eastern United States. Industrial sector consumption increased by 1% week over week. In the residential and commercial sectors, consumption increased by 12% as some areas saw much-cooler-than-normal temperatures. Natural gas exports to Mexico increased 11%, as maintenance finished on the Los Ramones II – Norte pipeline.
U.S. liquefied natural gas (LNG) exports remain unchanged week over week. Three vessels (combined LNG-carrying capacity of 11.0 Bcf) departed Sabine Pass last week (Thursday to Wednesday), and one vessel (LNG-carrying capacity 3.6 Bcf) was loading at the terminal on Wednesday.
In June, one of the long-term contracts for off-take volumes from Sabine Pass between Cheniere Energy and South Korea’s company Korea Gas Corp. (KOGAS) commenced. The contract was originally signed in 2012 and calls for delivery of 0.46 Bcf/d of LNG from Sabine Pass Train 3 to South Korea for 20 years. The first two tankers (SM Eagle and Hyundai Princepia) were loaded at the terminal on June 3 and June 15, respectively, according to data compiled by Bloomberg.
Storage:
Weekly net injections continue to be smaller than the five-year average. Net injections into storage totaled 46 Bcf, compared with the five-year (2012–16) average net injection of 72 Bcf and last year's net injections of 41 Bcf during the same week. For seven out of the last eight weeks, the weekly net injection has been smaller than the five-year average. This is likely a reflection of increased of storage levels above historical norms, combined with electric sector demand and relatively higher levels of natural gas exports. Working gas stocks total 2,816 Bcf, which is 181 Bcf more than the five-year average and 319 Bcf less than last year at this time.
For the second week in a row, unseasonably hot temperatures lead to net withdrawals in the South Central Salt region. Net withdrawals of 2 Bcf were reported in the South Central Salt region for the second week of net withdrawals in a row. Prior to last week, the last net withdrawal was for the week ending March 24. Warmer-than-normal temperatures in the region likely contributed to increased electric generation demand for natural gas, resulting in withdrawals of natural gas from storage. Because natural gas salt dome facilities possess high deliverability and are able to cycle through their inventories multiple times a year, withdrawals from storage in the South Central region are not uncommon during the summer.
Net injections into working gas storage were below the five-year average in every region of the Lower 48 states. Net injections fell below the five-year average in all regions of the Lower 48 states this week, as hot weather prevailed across the country. The net injection in the South Central region was 10 Bcf below the five-year average, driven mostly by nonsalt facilities, which injected 7 Bcf less than the five-year average. The Pacific region’s net injection was 7 Bcf lower than the five-year average, and the Midwest region’s was 6 Bcf lower than the five-year average. Other regions were fairly close to historic averages.
The January futures price is trading at a premium over the current spot price, but the premium is smaller than a year ago. During the most recent storage week, the average natural gas spot price at the Henry Hub was $2.88/MMBtu, while the Nymex futures price of natural gas for delivery in January 2018 averaged $3.27/MMBtu, a difference of 39¢. The premium was 61¢ a year ago. In comparison, the average natural gas spot price at the Henry Hub was $2.88/MMBtu, 5¢ lower than the front-month futures price at the Nymex. A year ago, the spot price was 1¢ higher than the front-month contract.
Reported net implied flows into storage are lower than median estimates, but within the range of expectations. According to Bloomberg’s survey of natural gas analysts, estimates of net injections to working natural gas storage ranged from 34 Bcf to 56 Bcf with a median of 52 Bcf. Prices of the Nymex futures contracts for August 2017 delivery at Henry Hub increased 3¢ to $3.10/MMBtu in 666 trades at the release of the Weekly Natural Gas Storage Report (WNGSR). Prices continued to climb in subsequent trading, rising to $3.11/MMBtu.
As with last week, warmer-than-normal temperatures lead to smaller than normal injections into storage. Temperatures in the Lower 48 states averaged 75 degrees Fahrenheit (°F), 3°F higher than the normal and 1°F higher than last year at this time. Cooling degree days (CDD) in the Lower 48 states totaled 73, compared to 69 last year and compared to a normal of 54. Temperatures in the West South Central Census division averaged 82°F, 2°F higher than the normal and 2°F lower than last year at this time. CDD in the West South Central Census division totaled 119, compared to 131 last year and compared to a normal of 106.
See also:
| Spot Prices ($/MMBtu) | Thu, 22-Jun |
Fri, 23-Jun |
Mon, 26-Jun |
Tue, 27-Jun |
Wed, 26-Jun |
|---|---|---|---|---|---|
| Henry Hub |
2.85 |
2.86 |
2.98 |
2.98 |
3.01 |
| New York |
2.47 |
2.20 |
2.12 |
2.06 |
2.56 |
| Chicago |
2.71 |
2.69 |
2.78 |
2.83 |
2.84 |
| Cal. Comp. Avg.* |
2.89 |
2.79 |
2.87 |
2.84 |
2.85 |
| Futures ($/MMBtu) | |||||
| July Contract | 2.894 |
2.929 |
3.027 |
3.037 |
3.067 |
| August Contract |
2.915 |
2.951 |
3.049 |
3.064 |
3.094 |
| *Avg. of NGI's reported prices for: Malin, PG&E Citygate, and Southern California Border Avg. | |||||
| Source: NGI's Daily Gas Price Index | |||||
| U.S. natural gas supply - Gas Week: (6/22/17 - 6/28/17) | |||
|---|---|---|---|
Average daily values (Bcf/d): |
|||
this week |
last week |
last year |
|
| Marketed production | 80.7 |
80.3 |
80.1 |
| Dry production | 71.6 |
71.3 |
71.3 |
| Net Canada imports | 5.7 |
6.0 |
6.2 |
| LNG pipeline deliveries | 0.0 |
0.0 |
0.0 |
| Total supply | 77.2 |
77.2 |
77.5 |
|
Source: OPIS PointLogic Energy, an IHS Company | |||
| U.S. natural gas consumption - Gas Week: (6/22/17 - 6/28/17) | |||
|---|---|---|---|
Average daily values (Bcf/d): |
|||
this week |
last week |
last year |
|
| U.S. consumption | 56.6 |
57.1 |
61.3 |
| Power | 29.4 |
30.7 |
34.6 |
| Industrial | 19.7 |
19.6 |
19.7 |
| Residential/commercial | 7.5 |
6.8 |
7.0 |
| Mexico exports | 4.4 |
3.9 |
3.8 |
| Pipeline fuel use/losses | 6.3 |
6.3 |
6.8 |
| LNG pipeline receipts | 1.6 |
1.8 |
0.5 |
| Total demand | 68.8 |
69.1 |
72.3 |
|
Source: OPIS PointLogic Energy, an IHS Company | |||
| Rigs | |||
|---|---|---|---|
Fri, June 23, 2017 |
Change from |
||
last week |
last year |
||
| Oil rigs | 758 |
1.5% |
129.7% |
| Natural gas rigs | 183 |
-1.6% |
103.3% |
| Note: Excludes any miscellaneous rigs | |||
| Rig numbers by type | |||
|---|---|---|---|
Fri, June 23, 2017 |
Change from |
||
last week |
last year |
||
| Vertical | 77 |
-6.1% |
45.3% |
| Horizontal | 792 |
1.3% |
143.7% |
| Directional | 72 |
4.3% |
67.4% |
| Source: Baker Hughes Inc. | |||
| Working gas in underground storage | ||||
|---|---|---|---|---|
Stocks billion cubic feet (Bcf) |
||||
| Region | 2017-06-23 |
2017-06-16 |
change |
|
| East | 536 |
513 |
23 |
|
| Midwest | 676 |
656 |
20 |
|
| Mountain | 184 |
182 |
2 |
|
| Pacific | 280 |
281 |
-1 |
|
| South Central | 1,140 |
1,138 |
2 |
|
| Total | 2,816 |
2,770 |
46 |
|
| Source: U.S. Energy Information Administration | ||||
| Working gas in underground storage | |||||
|---|---|---|---|---|---|
Historical comparisons |
|||||
Year ago (6/23/16) |
5-year average (2012-2016) |
||||
| Region | Stocks (Bcf) |
% change |
Stocks (Bcf) |
% change |
|
| East | 629 |
-14.8 |
584 |
-8.2 |
|
| Midwest | 739 |
-8.5 |
605 |
11.7 |
|
| Mountain | 197 |
-6.6 |
156 |
17.9 |
|
| Pacific | 315 |
-11.1 |
312 |
-10.3 |
|
| South Central | 1,253 |
-9.0 |
979 |
16.4 |
|
| Total | 3,135 |
-10.2 |
2,635 |
6.9 |
|
| Source: U.S. Energy Information Administration | |||||
| Temperature – heating & cooling degree days (week ending Jun 22) | ||||||||
|---|---|---|---|---|---|---|---|---|
HDD deviation from: |
CDD deviation from: |
|||||||
| Region | HDD Current |
normal |
last year |
CDD Current |
normal |
last year |
||
| New England | 4 |
-6 |
0 |
35 |
18 |
13 |
||
| Middle Atlantic | 0 |
-5 |
-2 |
51 |
20 |
10 |
||
| E N Central | 3 |
-4 |
2 |
51 |
13 |
-12 |
||
| W N Central | 4 |
-3 |
4 |
55 |
6 |
-27 |
||
| South Atlantic | 0 |
0 |
0 |
93 |
14 |
7 |
||
| E S Central | 0 |
0 |
0 |
77 |
3 |
-17 |
||
| W S Central | 0 |
0 |
0 |
119 |
13 |
-12 |
||
| Mountain | 2 |
-16 |
-2 |
91 |
33 |
18 |
||
| Pacific | 3 |
-9 |
-9 |
71 |
46 |
37 |
||
| United States | 2 |
-5 |
-1 |
73 |
19 |
4 |
||
|
Note: HDD = heating degree day; CDD = cooling degree day Source: National Oceanic and Atmospheric Administration | ||||||||
Average temperature (°F)
7-Day Mean ending Jun 22, 2017
Source: NOAA National Weather Service
Deviation between average and normal (°F)
7-Day Mean ending Jun 22, 2017
Source: NOAA National Weather Service