In the News:
European natural gas storage remains low heading into winter
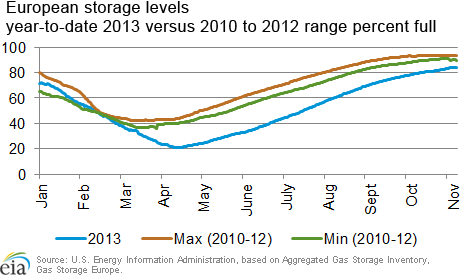
Unlike in the United States, where natural gas inventories just before winter are above average, European storage levels at the end of October were significantly lower than normal for this time of year. For 2007-12, European gas storage averaged more than 94% full in the final week of October. This year, it's at 84% full. The lower storage level is largely a result of heavy withdrawals earlier in the year because of cold March weather. Europe, like the United States, this year experienced an unusually cold March, the fourth coldest on record (since 1910) in the United Kingdom and the sixth coldest on record (since 1881) in Germany.
Overall, European natural gas storage levels were fairly normal as the year began. However, by the end of March, European storage was just 24% full, versus a 2010-12 average of 41% full for that time of year. The natural gas storage deficit compared to previous years widened as withdrawals from storage continued into mid-April and as May and June injections got off to a slow start. With relatively low imports in the first half of 2013 and declining production, Europe's storage levels still have not fully recovered. While the United States also experienced an unusually cold March and heavy March withdrawals from natural gas storage, strong U.S. production growth has helped return U.S. storage levels to near least year's record highs.
Natural gas storage levels at the end of October this year vary across Europe, and in some regions storage levels have recovered since spring lows. For example, United Kingdom gas storage increased to 98% full this October compared with a 2010-12 average of 94%, while Denmark and the Netherlands were 82% full versus a prior average of 85%. However, natural gas storage levels in most of the rest of Europe remain low, with storage in the Baumgarten area – which covers Austria, Czech Republic, Hungary, Poland, and Slovakia – at just 72% full at the end of October versus an average of 87% full for the previous three years. Storage levels in Germany, Belgium, France, and Italy are also significantly below normal for this time of year.
Overview:
(For the Week Ending Wednesday, November 6, 2013)
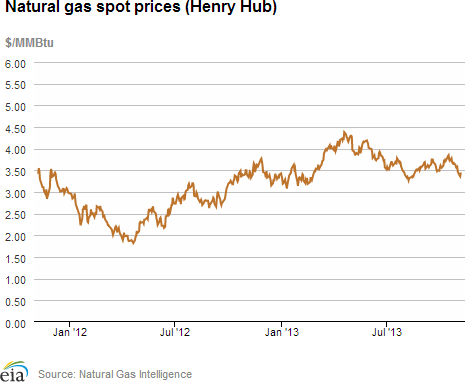
- Natural gas prices fell across most of the country over the report week (Wednesday to Wednesday). The Henry Hub spot price closed yesterday at $3.45 per million British thermal units (MMBtu), down 10 cents from $3.55/MMBtu at the beginning of the report week. This week, the Henry Hub spot price reached its lowest point in 12 weeks.
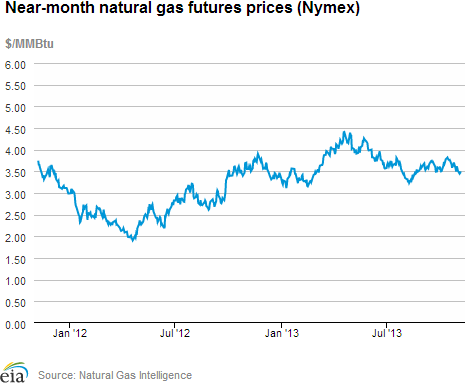
- At the New York Mercantile Exchange (Nymex), the December contract settled at $3.498/MMBtu yesterday, down 12 cents/MMBtu for the report period.
- Working natural gas in storage increased to 3,814 Bcf as of Friday, November 1, according to the U.S. Energy Information Administration's (EIA) Weekly Natural Gas Storage Report (WNGSR). A net storage injection of 35 billion cubic feet (Bcf) for the week resulted in storage levels 2.9% below year-ago levels but 1.5% above the 5-year average.
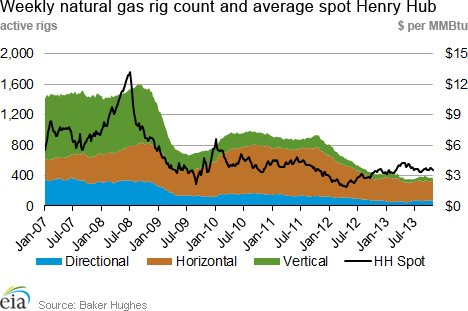
- The Baker Hughes natural gas rotary rig count totaled 360 active units as of Friday, November 1, a decrease of 16 rigs from the previous week. The oil rig count increased by 19 units over last week to 1,376. The total rig count is 1,742, up four rigs for the week.
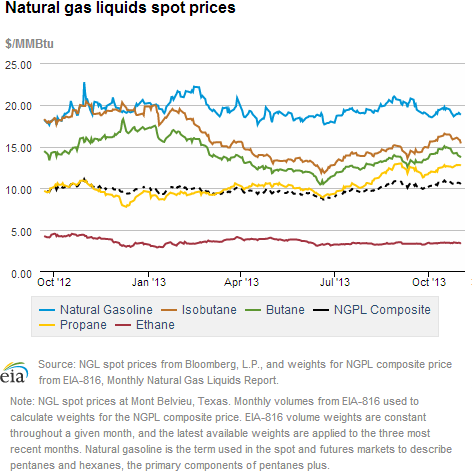
- The weekly average natural gas plant liquids composite price fell this week (covering October 28 through November 1) compared to the previous week by 0.3%, and is now at $10.64/MMBtu. Butane and isobutane fell by nearly 4% and 2%, respectively, while natural gasoline and ethane both fell by less than 1%. Propane increased by almost 2%.
Prices/Demand/Supply:
Spot prices fell throughout the country as demand declined in the residential/commercial and power sectors. The combined effect of reduced natural gas demand from residential and commercial consumers as temperatures warmed in the Northeast, Midwest, and Southeast, as well as reduced natural gas demand from electric generators, likely pushed the Henry Hub spot price down for the third week in a row, to its lowest point since the middle of August. The Henry Hub spot price decreased by 10 cents this week, to $3.45/MMBtu yesterday, from $3.55/MMBtu last Wednesday. The price drop was particularly strong in the Northeast, where the spot price at the Algonquin Citygate, which serves the Boston area, fell by 63 cents to $3.63/MMBtu, and where the spot price at Transco Zone 6 New York, delivering to New York City, fell by 33 cents/MMBtu to $3.29/MMBtu. While the Algonquin Citygate spot price settled yesterday at 18 cents/MMBtu above the Henry Hub spot price, the Transco Zone 6 New York spot price settled at a 16 cent/MMBtu discount to Henry Hub. Supply factors also played a role in lowering prices at Transco Zone 6 New York, as consumers served by this trading hub benefitted from a number of pipeline expansions that began service in the region on Friday, November 1.
Prices at the Nymex decreased this week. The December contract fell from $3.620/MMBtu last Wednesday to $3.498/MMBtu yesterday. This marked the third consecutive week that the near-month contract price declined alongside the Henry Hub spot price amid periods of warmer-than-normal weather.
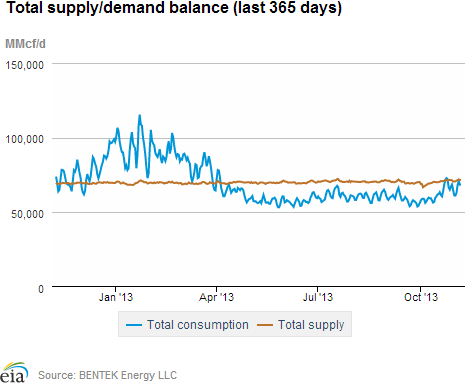
Residential/commercial and power sector demand falls. Consumption decreased by 3.5% from the previous week, largely because of a 3.2% decrease in residential and commercial consumption, and a 7.1% decrease in power sector consumption, according to data from Bentek Energy. Space heating demand declined as temperatures were warmer than last week in the Northeast, Midwest, and Southeast. This was compounded by the fourth consecutive week of declining demand from the electric power sector, as the season for air conditioning nears an end. The decline in power burn was fairly uniform throughout the country, but was especially pronounced in the Southeast and Southwest.
Natural gas supply decreases slightly. Total supply decreased by 0.1% from the previous week. Although dry gas production increased for the week by 0.5%, net imports of natural gas from Canada fell by 8.9%. LNG imports rose 11.5%, although the volume is minuscule.
Storage
Working natural gas in storage rose to 3,814 Bcf as of November 1. The 35-Bcf gain in storage levels was larger than the 27-Bcf injection that occurred during the same week in 2012, but a little less than the 5-year average increase of 36 Bcf. Current inventories are 112 Bcf (2.9%) less than last year at this time, but 57 Bcf (1.5%) above the 5-year (2008-12) average of 3,757 Bcf.
The net injection was in line with the market expectation of a 35 Bcf build. Prices on the Nymex upon release of the storage numbers were relatively steady. At 10:30 a.m., the price of the near month (December 2013) contract rose less than a penny to about $3.59/MMBtu.
Two of the three regions posted smaller-than-average builds. Net injections in the East region were 10 Bcf this week, 7 Bcf smaller than its 5-year average injection of 17 Bcf, and stocks remain 4.7% below the 5-year average for that region. Inventories in the West region grew by 3 Bcf this week, 4 Bcf smaller than its 5-year average injection of 7 Bcf, and stocks in that region are 8.6% over its 5-year average levels. The Producing region grew by 22 Bcf, 9 Bcf larger than its 5-year injection of 13 Bcf.
Cooler temperatures led to relatively small build. Temperatures in the Lower 48 states averaged 51.4 degrees for the week, 0.9 degree cooler than the 30-year normal temperature and 2.7 degrees cooler than the same period last year.
See also:
| Spot Prices ($/MMBtu) | Thu, 31-Oct |
Fri, 1-Nov |
Mon, 4-Nov |
Tue, 5-Nov |
Wed, 6-Nov |
|---|---|---|---|---|---|
| Henry Hub | 3.57 |
3.46 |
3.38 |
3.36 |
3.45 |
| New York | 3.22 |
3.32 |
3.44 |
3.25 |
3.29 |
| Chicago | 3.73 |
3.55 |
3.50 |
3.53 |
3.66 |
| Cal. Comp. Avg,* | 3.76 |
3.56 |
3.58 |
3.59 |
3.65 |
| Futures ($/MMBtu) | |||||
| December Contract | 3.581 |
3.513 |
3.445 |
3.446 |
3.498 |
| January Contract | 3.663 |
3.591 |
3.524 |
3.551 |
3.566 |
*Avg. of NGI's reported prices for: Malin, PG&E citygate, and Southern California Border Avg. |
| Source: NGI's Daily Gas Price Index | |||||
| U.S. Natural Gas Supply - Gas Week: (10/30/13 - 11/6/13) | ||
|---|---|---|
Percent change for week compared with: |
||
last year |
last week |
|
| Gross Production | 2.07%
|
0.50%
|
| Dry Production | 2.05%
|
0.50%
|
| Canadian Imports | -2.50%
|
-8.90%
|
| West (Net) | 9.60%
|
-7.08%
|
| MidWest (Net) | 2.47%
|
-13.76%
|
| Northeast (Net) | -48.56%
|
9.79%
|
| LNG Imports | -40.49%
|
11.50%
|
| Total Supply | 1.53%
|
-0.14%
|
| Source: BENTEK Energy LLC | ||
| U.S. Consumption - Gas Week: (10/30/13 - 11/6/13) | ||
|---|---|---|
Percent change for week compared with: |
||
last year |
last week |
|
| U.S. Consumption | -6.18%
|
-3.45%
|
| Power | -6.38%
|
-7.15%
|
| Industrial | -1.27%
|
-0.05%
|
| Residential/Commercial | -9.62%
|
-3.21%
|
| Total Demand | -5.58%
|
-3.31%
|
| Source: BENTEK Energy LLC | ||
| Rigs | |||
|---|---|---|---|
Fri, November 01, 2013 |
Change from |
||
last week |
last year |
||
| Oil Rigs | 1,376 |
1.40% |
0.22% |
| Natural Gas Rigs | 360 |
-4.26% |
-15.09% |
| Miscellaneous | 6 |
20.00% |
100.00% |
| Rig Numbers by Type | |||
|---|---|---|---|
Fri, November 01, 2013 |
Change from |
||
last week |
last year |
||
| Vertical | 408 |
4.35% |
-18.40% |
| Horizontal | 1,104 |
0.55% |
-0.09% |
| Directional | 230 |
-7.63% |
17.95% |
| Source: Baker Hughes Inc. | |||
| Working Gas in Underground Storage | ||||
|---|---|---|---|---|
Stocks billion cubic feet (bcf) |
||||
| Region | 11/1/13
|
10/25/13
|
change |
|
| East | 1,974 |
1,964 |
10
|
|
| West | 555 |
552 |
3
|
|
| Producing | 1,285 |
1,263 |
22
|
|
| Total | 3,814 |
3,779 |
35
|
|
| Source: U.S. Energy Information Administration | ||||
| Working Gas in Underground Storage | |||||
|---|---|---|---|---|---|
Historical Comparisons |
|||||
Year ago (11/1/12) |
5-year average (2008-2012) |
||||
| Region | Stocks (Bcf) |
% change |
Stocks (Bcf) |
% change |
|
| East | 2,095 |
-5.8 |
2,072 |
-4.7 |
|
| West | 547 |
1.5 |
511 |
8.6 |
|
| Producing | 1,284 |
0.1 |
1,174 |
9.5 |
|
| Total | 3,926 |
-2.9 |
3,757 |
1.5 |
|
| Source: U.S. Energy Information Administration | |||||
| Temperature -- Heating & Cooling Degree Days (week ending Oct 31) | ||||||||
|---|---|---|---|---|---|---|---|---|
HDD deviation from: |
CDD deviation from: |
|||||||
| Region | HDD Current |
normal |
last year |
CDD Current |
normal |
last year |
||
| New England | 153
|
27
|
78
|
0
|
0
|
0
|
||
| Middle Atlantic | 129
|
13
|
64
|
0
|
0
|
0
|
||
| E N Central | 140
|
12
|
24
|
0
|
-1
|
-3
|
||
| W N Central | 142
|
10
|
-11
|
0
|
-1
|
-4
|
||
| South Atlantic | 83
|
13
|
30
|
16
|
-2
|
0
|
||
| E S Central | 74
|
3
|
-5
|
3
|
0
|
0
|
||
| W S Central | 24
|
-13
|
-36
|
30
|
13
|
12
|
||
| Mountain | 109
|
-13
|
-16
|
6
|
1
|
-1
|
||
| Pacific | 58
|
5
|
25
|
0
|
-3
|
-1
|
||
| United States | 102
|
7
|
19
|
7
|
1
|
0
|
||
|
Note: HDD = heating degree-day; CDD = cooling degree-day Source: National Oceanic and Atmospheric Administration | ||||||||
Average temperature (°F)
7-Day Mean ending Oct 31, 2013
Source: NOAA/National Weather Service
Deviation between average and normal (°F)
7-Day Mean ending Oct 31, 2013
Source: NOAA/National Weather Service