5. High-GWP gases
5.1. Total emissions
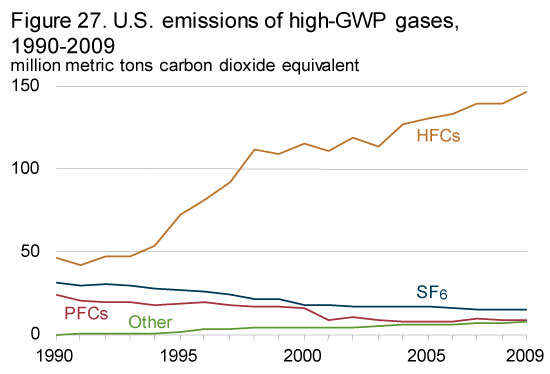
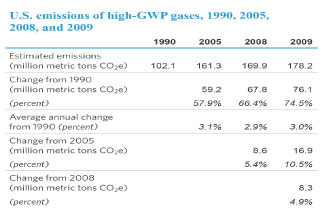
Greenhouse gases with high global warming potential (high-GWP gases) are hydrofluorocarbons (HFCs), perfluorocarbons (PFCs), and sulfur hexafluoride (SF6), which together represented 3 percent of U.S. greenhouse gas emissions in 2009.
Emissions estimates for the high-GWP gases are provided to EIA by the EPA's Office of Air and Radiation. The estimates for emissions of HFCs not related to industrial processes or electric transmission are derived from the EPA Vintaging Model. Emissions from manufacturing and utilities are derived by the EPA from a mix of public and proprietary data, including from the EPA's voluntary emission reduction partnership programs.
For this year's EIA inventory, 2008 values for HFC-23 from HCFC-22 production and for all industrial emissions of PFCs and SF6 are used as placeholders for 2009. The updated values will be available when the U.S. inventory is submitted by the EPA to the UNFCCC in April 2011. Emissions of HFCs used as substitutes for ozone-depleting substances and "other" HFCs and PFCs/PFPEs, which are aggregated to protect confidential data, have been updated for 2009, showing a 5.7-percent increase from 2008.
Emissions of high-GWP gases have increased steadily since 1990 (Figure 27 and Table 27), largely because HFCs are being used to replace chlorofluorocarbons (CFCs), hydrochlorofluorocarbons (HCFCs), and other ozone-depleting substances that are being phased out under the terms of the Montreal Protocol, which entered into force on January 1, 1989.
As part of the global phasedown of HCFCs, according to the U.S. schedule mandated in the Clean Air Act, 2010 was a target year to end production and imports of HCFC-142b and HCFC-22, with the exception of use in equipment manufactured before January 1, 2010. Under the Clean Air Act, U.S. HCFC production and imports will be completely phased out by January 1, 2030, as agreed upon in the Montreal Protocol.
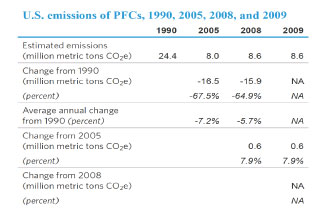
PFC emissions have declined since 1990 as a result of production declines in the U.S. aluminum industry, as well as industry efforts to lower emissions per unit of output.
5.2. Hydrofluorocarbons
HFCs are compounds that contain carbon, hydrogen, and fluorine. They are used as solvents, residential and commercial refrigerants, firefighting agents, and propellants for aerosols. Although they do not destroy stratospheric ozone, they are powerful greenhouse gases. For example, HFC-134a, the most prominent substitute for ozone-depleting substances, has a global warming potential of 1,430 according to the IPCC's Fourth Assessment Report (see Table 5 for GWP comparison).
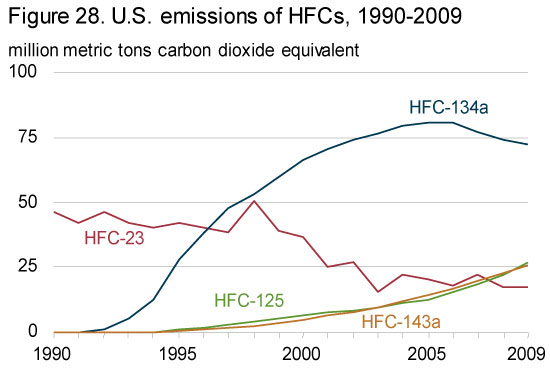
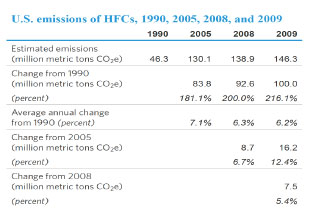
Emissions of substitutes for ozone-depleting substances, including HFC-23, HFC-32, HFC-125, HFC-134a, HFC-143a, and HFC-236fa, have grown from trace amounts in 1990 to 129 MMTCO2e in 2009 (Table 28).
All the growth in HFC emissions since 1990 can be attributed to the use of HFCs as replacements for ozone-depleting substances. HFC emissions from industrial and other applications have declined by 45.3 percent over this period. The market for chemicals to replace ozone-depleting substances is still expanding, with HFCs increasingly used in fire protection applications to replace Halon 1301 and Halon 1211.
Since 1997, HFC-134a—used as a replacement for CFCs in air conditioners for passenger vehicles, trains, and buses—has accounted for the largest share of total HFC emissions (Figure 28). In 2009, HFC-134a emissions represented 47 percent of total HFC emissions, including the group of other HFCs/PFCs/PFPEs.
To encourage vehicle manufacturers to reduce emissions of HFC-134a from mobile air conditioners, the EPA has included HFC crediting in the new fuel economy and emission standards for light-duty vehicles that were published in April 2010. The rule includes flexibility provisions by which manufacturers can receive credits toward the CO2e emission standard by using air conditioners with low leak rates or alternative refrigerants.45
Emissions of HFC-32, HFC-125, and HFC-143a each have more than tripled over the past 8 years. HFC-32 and HFC-125 are components of the refrigerant blend R-410, which is used in many air-conditioning applications. As the prevalence of air-conditioning equipment has grown, the use of R-410 has increased substantially. HFC-143a and HFC-125 are the major constituents of refrigerant blends R-404A and R-507A, which are used in commercial refrigeration applications. As the number of grocery and other stores using refrigeration has grown, so has the demand for refrigeration equipment and, thus, for HFC-143a and HFC-125.
Under the Clean Air Act, manufacture and import of HCFC-22, except for use as a feedstock and in equipment manufactured before 2010, was scheduled to be phased out by January 1, 2010. Manufacturers of HCFC-22 are using cost-effective methods to make voluntary reductions in the amount of HFC-23 created as a byproduct of HCFC-22 manufacture; however, HCFC-22 production remains a steady source of U.S. emissions of HFC-23.
Because the use of HFCs to replace ozone-depleting CFCs and HCFCs increases GHG emissions, multilateral discussions have been ongoing since 2009 to consider adding HFCs to the Montreal Protocol. Negotiations have centered on similar proposals from the Federated States of Micronesia and jointly from the United States, Canada, and Mexico that seek to amend the Montreal Protocol to create a schedule for phasing down consumption of HFCs.
5.3. Perfluorocarbons
The two principal sources of U.S. PFC emissions are domestic aluminum production and semiconductor manufacture, which yield perfluoromethane (CF4) and perfluoroethane (C2F6).
Total emissions of PFCs have fallen by two-thirds since 1990 (Figure 29 and Table 29). PFC emissions from aluminum production have declined markedly since 1990 (although the decline has been offset in part by increased emissions from semiconductor manufacturing). Emissions from process inefficiencies during aluminum production, known as "anode effects," have been greatly reduced, and in addition, high costs for alumina and energy have led to production cutbacks.
Perfluoroethane is used as an etchant and cleaning agent in semiconductor manufacturing. The portion of the gas that does not react with the materials is emitted to the atmosphere. Established in 1996, the PFC Reduction/Climate Partnership for the Semiconductor Industry aims to reduce, via process efficiency upgrades, emissions of several high-GWP gases that result from the manufacture of semiconductors, including perfluoroethane.46 From 1995 to 2008, total emissions of high-GWP gases (in terms of carbon dioxide equivalents) from the U.S. semiconductor industry fell by 12.6 percent, including a 6.4-percent drop in PFC emissions.

5.4. Sulfur hexafluoride
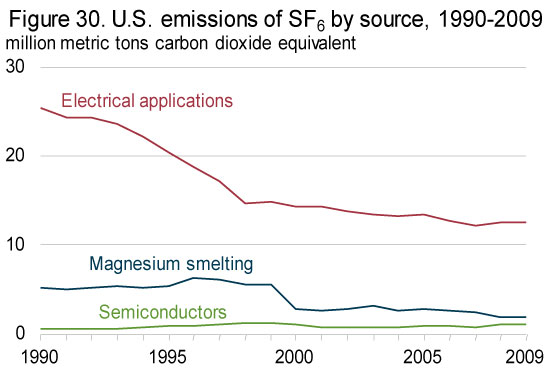
SF6, an excellent dielectric gas or insulating gas for high-voltage applications, is used primarily in electrical applications—as an insulator and arc interrupter for circuit breakers, switch gear, and other equipment in electricity transmission and distribution systems. Other, minor applications of SF6 include leak detection and the manufacture of loudspeakers and lasers and as an atmospheric tracer for experimental purposes.
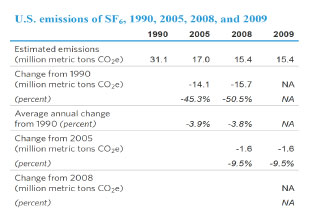
Total U.S. emissions of SF6 have declined by more than 50 percent since 1990 (Figure 30 and Table 30), and industry efforts to reduce emissions of SF6 from electrical power systems have led to a decline of more than 50 percent in emissions of SF6 from utility systems since 1990. Seventy-seven members of the electric power industry (about 45 percent of the industry) participate in the SF6 Emission Reduction Partnership for Electric Power Systems by reporting and reducing SF6 emissions. Since the establishment of the Partnership, the SF6 emission leakage rate of participants had dropped from 17 percent to 7 percent annually as of 2006.47
SF6 is also used in the manufacture of semiconductors, where fluorinated gases are used in plasma etching, plasma-enhanced chemical vapor deposition, magnesium metal casting, and in magnesium production as a cover gas. Emissions of SF6 from the semiconductor industry have more than doubled since 1990. In contrast, emissions from the magnesium industry have fallen over time. Established in 1999, the SF6 Emission Reduction Partnership for the Magnesium Industry aims to eliminate SF6 emissions from magnesium production and casting processes by the end of 2010 by optimizing equipment design and operation and improving SF6 gas management practices.48 Emissions of SF6 from the magnesium smelting industry fell by 65 percent from 1995 to 2008 (Table 30).
Footnotes
45U.S. Environmental Protection Agency, EPA and NHTSA Finalize Historic National Program To Reduce Greenhouse Gases and Improve Fuel Economy for Cars and Trucks, EPA-420-F-10-014 (Washington, DC, April 2010), website www.epa.gov/otaq/climate/regulations/420f10014.htm.
46U.S. Environmental Protection Agency, "PFC Reduction / Climate Partnership for the Semiconductor Industry," website https://www.epa.gov/f-gas-partnership-programs/pfc-emission-reduction-partnership-semiconductor-industry.
47U.S. Environmental Protection Agency, "SF6 Emission Reduction Partnership for Electric Power Systems," website https://www.epa.gov/f-gas-partnership-programs/epas-sf6-emission-reduction-partnership-electric-power-systems.
48U.S. Environmental Protection Agency, "SF6 Emission Reduction Partnership for the Magnesium Industry," website https://www.epa.gov/f-gas-partnership-programs/epas-sf6-emission-reduction-partnership-magnesium-industry.