2. Carbon Dioxide Emissions
2.1. Total carbon dioxide emissions
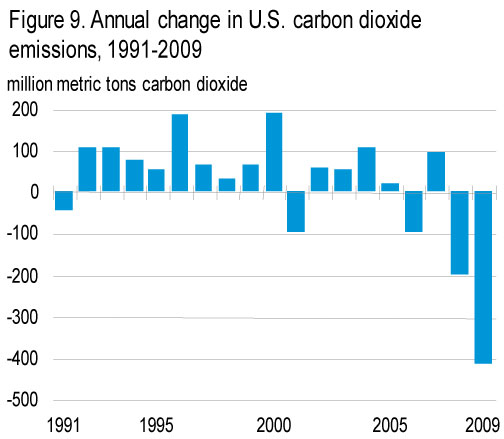
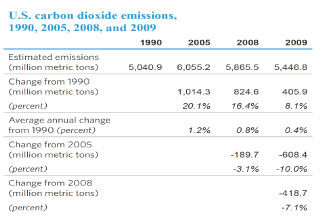
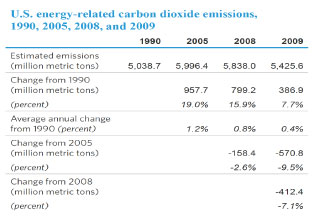
Annual U.S. carbon dioxide emissions fell by 419 million metric tons in 2009 (7.1 percent), to 5,447 million metric tons (Figure 9 and Table 6). The annual decrease—the largest over the 19-year period beginning with the 1990 baseline—puts 2009 emissions 608 million metric tons below the 2005 level, which is the Obama Administration's benchmark year for its goal of reducing U.S. emissions by 17 percent by 2020.
The key factors contributing to the decrease in carbon dioxide emissions in 2009 included an economy in recession with a decrease in gross domestic product of 2.6 percent, a decrease in the energy intensity of the economy of 2.2 percent, and a decrease in the carbon intensity of energy supply of 2.4 percent.
Energy-related carbon dioxide emissions accounted for 98 percent of U.S. carbon dioxide emissions in 2009 (Table 6) when adjusted for bunker fuels and U.S. Territories. The predominant share of carbon dioxide emissions comes from fossil fuel combustion, with smaller amounts from the nonfuel use of energy and emissions from U.S. Territories and international bunker fuels. Other relatively small sources include emissions from industrial processes, such as cement and limestone production.
2.2. Energy-related carbon dioxide emissions
Energy-related carbon dioxide emissions account for more than 80 percent of U.S. greenhouse gas emissions. These emissions were down by 7.1 percent from 5,838 million metric tons in 2008 to 5,426 million metric tons in 2009. EIA breaks energy use into four end-use sectors (Table 7), and emissions from the electric power sector are attributed to the end-use sectors based on electricity sales to each sector. Growth in energy-related carbon dioxide emissions since 1990 has resulted largely from increases associated with electric power generation and transportation fuel use. All other energy-related carbon dioxide emissions (from direct fuel use in the residential, commercial, and industrial sectors) have been either flat or declining in recent years (Figure 10). In 2009, however, emissions from both electric power and transportation fuel use were down—by 9.0 percent and 4.3 percent, respectively—continuing a trend from 2008.
Reasons for the long-term growth in electric power and transportation sector emissions include: population growth; increased demand for electricity for computers and electronics in homes and offices; strong growth in demand for commercial lighting and cooling; substitution of new electricity-intensive technologies, such as electric arc furnaces for steelmaking in the industrial sector; and increased travel as a result of relatively low fuel prices and robust economic growth in the 1990s and early 2000s. Likewise, the recent declines in emissions from both the transportation and electric power sectors are tied to the economy, with people driving less and consuming less electricity over the years 2008 and 2009.
Other sources of U.S. energy-related carbon dioxide emissions have remained constant or declined, for reasons that include increased efficiencies in heating technologies, declining activity in older "smokestack" industries (such as steel, paper, and chemicals), and the growth of less energy-intensive industries, such as computers and electronics.

2.3. Residential sector carbon dioxide emissions
Residential sector carbon dioxide emissions originate primarily from:
- Direct fuel consumption (principally, natural gas) for heating and cooking
- Electricity for cooling (and heating), appliances, lighting, and increasingly for televisions, computers, and other household electronic devices (Table 8).
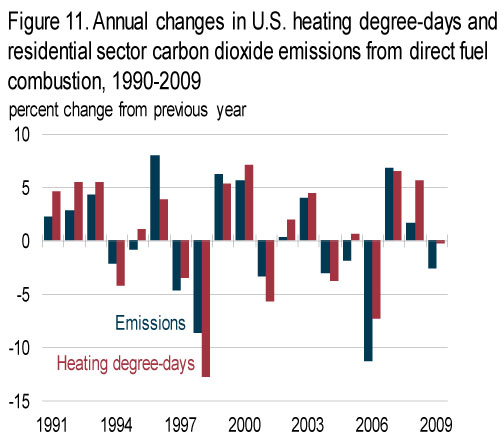
Energy consumed for heating and cooling in homes and businesses has a large influence on annual fluctuations in energy-related carbon dioxide emissions because of variability in the weather as measured by heating and cooling degree-days. In 2009, heating degree-days were down slightly from 2008 (Figure 11). Although annual changes in cooling degree-days have a smaller impact on energy demand, the 4-percent decrease in 2009 helped to reduce emissions further.
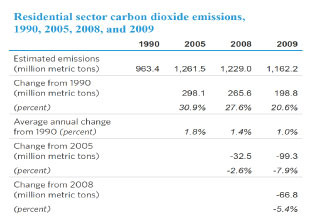
In the longer run, residential emissions are affected by population growth, income, and other factors. From 1990 to 2009:
- Residential sector carbon dioxide emissions grew by an average of 1.0 percent per year.
- U.S. population is estimated to have grown by an average of about 1.1 percent per year.
- Income per capita (measured in constant dollars) grew by an average of 1.4 percent per year.
- Energy efficiency improvements for homes and appliances offset much of the growth in the number and size of housing units. As a result, direct emissions of carbon dioxide from the consumption of petroleum, coal, and natural gas in the residential sector in 2009 were up by only 0.9 percent from the 1990 level.
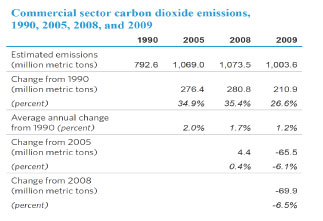
2.4. Commercial sector carbon dioxide emissions
In the commercial sector, carbon dioxide emissions result largely from energy use for lighting, heating, and cooling in commercial structures, such as office buildings, shopping malls, schools, hospitals, and restaurants.
Commercial sector emissions declined by 6.5 percent in 2009.
Lighting accounts for a larger component of energy demand in the commercial sector (approximately 18 percent of total demand in 2008) than in the residential sector (approximately 11 percent of total demand).
Commercial sector emissions are affected less by weather than are residential sector emissions: heating and cooling accounted for approximately 37 percent of energy demand in the residential sector in 2008 but only about 21 percent in the commercial sector.
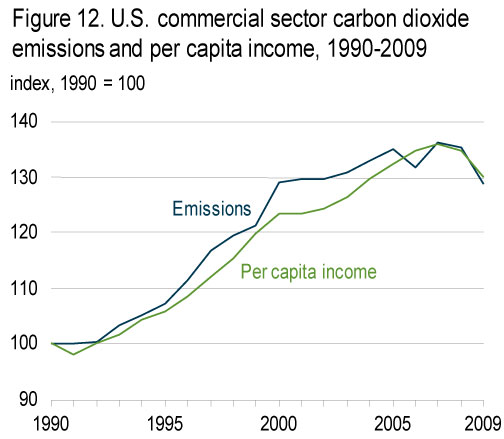
In the longer run, trends in commercial sector emissions parallel trends in population growth and the economy. Commercial sector emissions grew at an average annual rate of 1.2 percent from 1990 to 2009—slightly less than the average growth of 1.4 percent per year in real income per capita (Figure 12).
Emissions from direct fuel consumption in the commercial sector declined from 1990 to 2009 (Table 9), while the sector's electricity-related emissions increased by an average of 1.7 percent per year.
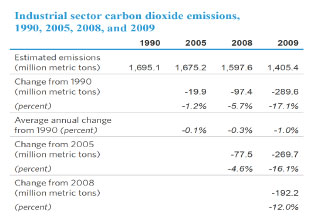
2.5. Energy-related industrial sector carbon dioxide emissions
Trends in U.S. industrial sector emissions are closely tied to economic output in energy-intensive manufacturing. In 2009, industrial carbon dioxide emissions fell by 12.0 percent from their 2008 level and were 17.1 percent (290 million metric tons) below their 1990 level (Table 10). Decreases in industrial sector carbon dioxide emissions have resulted largely from a structural shift away from energy-intensive manufacturing in the U.S. economy. The share of manufacturing activity represented by less energy-intensive industries, such as computer chip and electronic component manufacturing, has increased, while the share represented by the more energy-intensive industries has fallen.
Coke plants consumed 15 million short tons of coal in 2009, down from 39 million short tons in 1990. Other industrial coal consumption declined from 76 million short tons in 1990 to 45 million short tons in 2009, as reflected by a drop in emissions from coal use (Figure 13). From 1990 to 2009, coal use in the industrial sector declined by 47 percent.
Emissions from coal, natural gas, and total petroleum use in 2009 all were below their 1990 levels, although emissions from the combustion of some petroleum products were above their 1990 levels.

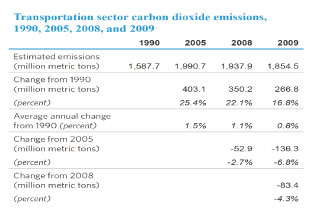
2.6. Transportation sector carbon dioxide emissions
Carbon dioxide emissions from the U.S. transportation sector in 2009 were 81 million metric tons lower than in 2008 but still 267 million metric tons higher than in 1990 (Table 11).
The transportation sector has led all U.S. end-use sectors in emissions of carbon dioxide since 1999; however, with a decline in economic growth in 2009, emissions from the transportation sector fell by 4.3 percent from their 2008 level, which in turn were down from 2007.
Petroleum combustion is by far the largest source of carbon dioxide emissions in the transportation sector.
Increases in the consumption of ethanol fuel in recent years have mitigated the growth in transportation sector emissions. (Reported emissions from energy inputs to ethanol production plants are counted in the industrial sector.)
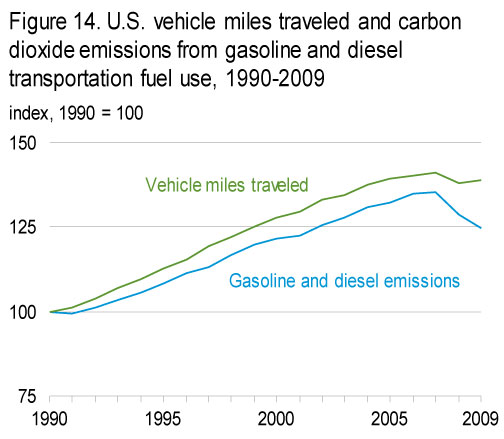
Emissions from gasoline and diesel fuel combustion in the transportation sector generally have paralleled total vehicle miles traveled since 1990 (Figure 14). In 2009, however, vehicles miles traveled rose slightly while combined emissions from gasoline and diesel fuel declined—likely as a result of more efficient vehicles and increased consumption of biofuels.
The transportation sector has dominated the growth in U.S. carbon dioxide emissions since 1990, accounting for 69 percent of the total increase in U.S. energy-related carbon dioxide emissions.
2.7. Electric power sector carbon dioxide emissions
The electric power sector consists of companies whose primary business is the generation of electricity. Since about 2000, as a result of changes in the fuel mix and efficiency improvements, electricity sales growth has outpaced the growth in emissions from the power sector (Figure 15).
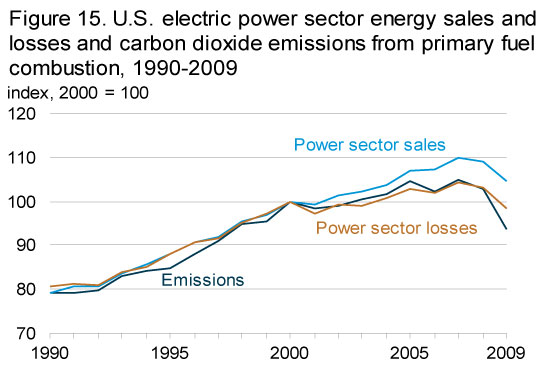
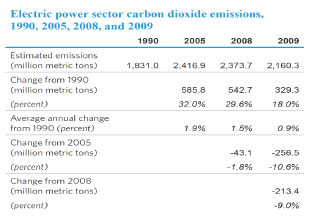
Carbon dioxide emissions from U.S. electric power generation declined by 9.0 percent in 2009 (Table 12). The drop resulted from a 4.1-percent decrease in the sector's total electricity generation and a 5.1-percent reduction in the carbon intensity of the electricity supply. The lower overall carbon intensity of power generation in 2009 was, in part, the result of a 33.5-percent increase (19 billion kilowatthours) in generation from wind resources. Although there was a slight drop in generation from nuclear power plants, hydroelectric generation increased by 7.3 percent, and total generation from all the energy sources that produce no direct carbon dioxide emissions increased by 2.7 percent from 2008.
Although electric power sector generation from all fossil fuels in 2009 was 196 billion kilowatthours lower than in 2008 (7.0 percent), generation from natural gas, the least carbon-intensive fossil fuel, increased by 4.8 percent.
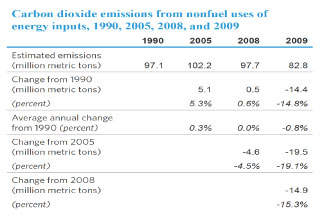
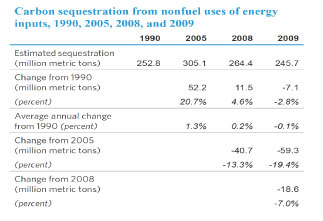
2.8. Carbon dioxide emissions and carbon sequestration from nonfuel uses of energy inputs
Nonfuel uses of fossil fuels (for purposes other than their energy value) create carbon dioxide emissions and also sequester carbon in nonfuel products, such as plastics.
In 2009, carbon dioxide emissions from nonfuel uses of energy inputs totaled 83 million metric tons—15.3 percent below the 2008 total (Table 13). Carbon sequestration from nonfuel uses of energy inputs in 2009 included 246 million metric tons carbon dioxide equivalent (CO2e) that was sequestered in nonfuel products rather than emitted to the atmosphere (Table 14). The 2009 sequestration total was 7.0 percent below the 2008 total.
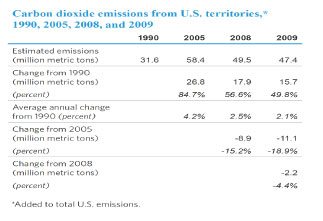
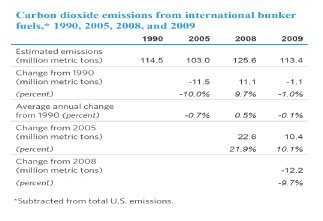
2.9. Adjustments to energy consumption
EIA's greenhouse gas emissions inventory includes two adjustments to energy-related carbon dioxide emissions (Table 15). First, the unadjusted energy consumption and carbon dioxide emissions data in this report correspond to EIA's coverage of energy consumption, which includes the 50 States and the District of Columbia; but under the UNFCCC, the United States is also responsible for emissions emanating from its Territories. Therefore, emissions from the Territories are added as an adjustment to the U.S. total. Second, because the UNFCCC definition of energy consumption excludes international bunker fuels, emissions from international bunker fuels are subtracted from the U.S. total. Similarly, emissions from military bunker fuels are also subtracted from the U.S. total.
The net adjustment in emissions has been negative in every year from 1990 to 2009, because emissions from international and military bunker fuels have exceeded emissions from U.S. Territories in each of the years. The net negative adjustment for 2009 was 66 million metric tons.
2.10. Other carbon dioxide emissions sources
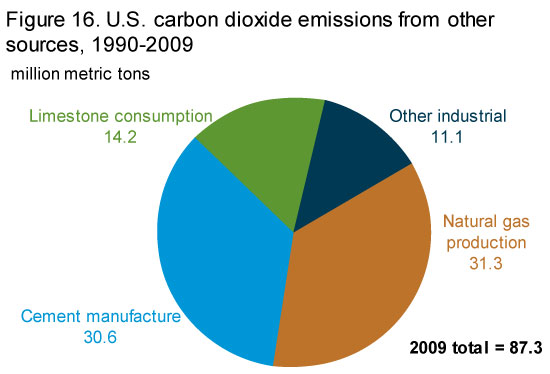
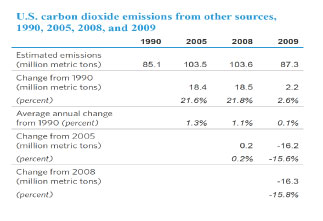
"Other emissions sources" in total accounted for 87 million metric tons of carbon dioxide in 2009, or less than 2 percent of the U.S. total.
In 2009, the second-largest source of U.S. carbon dioxide emissions (after fossil fuel consumption) was natural gas production (Figure 16 and Table 16), which includes flaring of natural gas at the wellhead and "scrubbing" of carbon dioxide from natural gas after it has been produced.
Cement manufacture, where most emissions result from the production of clinker (consisting of calcium carbonate sintered with silica in a cement kiln to produce calcium silicate), was the fourth-largest source of U.S. carbon dioxide emissions in 2009, after energy, nonfuel use of fossil fuels, and natural gas production.
Limestone consumption, especially for lime manufacture, is the source of 14 to 20 million metric tons of carbon dioxide emissions per year.
In addition, "other sources" of U.S. carbon dioxide emissions include soda ash manufacture and consumption; carbon dioxide manufacture; aluminum manufacture; and waste combustion in the commercial and industrial sectors.