1997 RECS Survey Data 2024 | 2020 | 2015 |2009 | 2005 | 2001 | 1997 | 1993 | Previous
Jump Menu
1997 Survey Methods
The Residential Energy Consumption Survey (RECS) was designed by the Energy Information Administration (EIA) to provide information about energy consumption within the residential sector. The RECS is conducted in two major parts: the Household Survey and the Energy Suppliers Survey. The Household Survey collects information about the housing unit through personal interviews with a representative national sample of households. The Rental-Agent Survey is an adjunct to the Household Survey and is used to verify information provided by renters in the Household Survey. In the Energy Suppliers Survey, data concerning actual energy consumption are obtained from household billing records maintained by the energy suppliers. The data are collected by questionnaires mailed to all the suppliers for the households in the Household Survey. This electronic report is based on the results of the Household Survey. A later report, Household Energy Consumption and Expenditures 1997, will present the results of the Energy Suppliers Survey. A subcontractor to EIA was used to collect and process the 1997 RECS. Click for copies of the data collection forms for the Household Survey and the adjunct Rental-Agent Survey.
This appendix contains detailed information about the sample design, Household Survey, its adjunct Rental Agent Survey, and confidentiality of the survey information.
Sample Design
The sample design for the 1997 RECS was based on the design used for the 1993 RECS. The universe for this sample design includes all housing units occupied as the primary residence in the 50 States and the District of Columbia. The RECS does not cover vacant housing units, seasonal units, nor second homes. Households on military installations are included. The definition of household is the same as that used by the U. S. Bureau of the Census. In RECS, by definition, the number of households is the same as the number of occupied primary housing units and these terms are used interchangeably. The universe was estimated to contain 101,481,000 households based on extrapolations from Current Population Survey (CPS) estimates at the time of the 1997 RECS (July 1997). This definition excludes group quarters such as military barracks, dormitories, and nursing homes, which are considered to be out-of-scope. It should be noted that the separation time between the estimates for 1993 and 1997 was 4 years, instead of the 2-2/3 years between the 1990 and 1993 estimates. Estimates of annual change need to take this difference into account.
The overall plan for the 1997 RECS included a basic sample of approximately 5,000 completed household interviews, plus a supplemental sample totaling approximately 800 completed interviews. The basic sample was designed to represent the total population of households in the United States, with specified levels of precision for each of the nine geographically defined Census divisions. The supplemental sample, included in the plan to meet special analytical needs, was designed to provide disproportionately large samples of households living below the poverty level, particularly those using electricity, fuel oil, or kerosene as the main space-heating fuel.
Multistage Area Probability Sample
In a multistage area probability sample design, the universe is broken up into successively smaller, statistically selected areas. The process starts with the selection of primary sampling units (PSUs) and ends with the selection of individual households.
Primary Sampling Units (PSUs)
PSUs are either metropolitan areas containing a central city of 50,000 or larger population, or they are counties or groups of counties containing small cities and rural areas. In the sample design used for the 1997 RECS, the total land area of the 50 States and the District of Columbia was divided into 1,786 PSUs. These PSUs were based on county and independent city boundaries and on Metropolitan Statistical Areas (MSAs) as defined in June 1990.
The primary mode of stratification of PSUs was by the nine Census divisions. Strata were separately defined within Census divisions for four populous States (California, Florida, New York, and Texas) and for two States with unique weather conditions (Alaska and Hawaii). Stratification was also based on MSA or nonMSA status of PSUs and, to the extent feasible, on dominant residential space-heating fuel and weather conditions. PSUs were grouped into 116 strata with one PSU selected from each strata. The PSUs that were selected for the 1993 RECS were also used for the 1997 RECS.
Secondary Sampling Units (SSUs)
A number of SSUs, usually eight or more, were selected in each PSU. SSUs consisted of one or more Census blocks, selected directly from Census statistics. Blocks were combined, as necessary, to create SSUs that contained at least 50 housing units.
The 1997 RECS sample design completed the redesign effort that started with the 1993 RECS. The SSUs used for the 1997 RECS were either the SSUs selected in the redesign effort or were SSUs selected as part of a new construction update procedure.
The starting point for the SSU new construction update procedure was the set of SSUs selected for the 1993 RECS. The first step was to expand the 1993 SSUs. A new construction update procedure was used to determine if significant new construction--defined as groups of 50 or more housing units--had occurred within the expanded SSUs since 1993. This was based on a canvass, primarily by telephone, of local sources of information, such as building-permit-issuing agencies, zoning boards, and tax offices. If no significant new construction had occurred, the SSU selected for the 1993 RECS was used for the 1997 RECS. If significant new construction had occurred, rough counts of the number of housing units by block were obtained for the expanded SSU, the expanded SSU was divided into segments, and a segment was selected. The selected segment was then used as the SSU for the 1997 RECS.
The detailed field listings of all housing units in the 1997 RECS SSUs were either carried over from the 1993 RECS or were created by field workers who visited the SSUs and identified each housing unit by street address, apartment number, or other obvious features. New field listings were necessary for SSUs in PSUs where the redesign effort was not completed for the 1993 RECS and for SSUs where significant new construction was found in the corresponding expanded SSU. A penultimate cluster of approximately 50 housing units was selected from each SSU.
Addresses of these housing units were placed in a database used for actual sample selection.
Sample Selection--Ultimate Clusters
Specific addresses chosen from each of the field listings comprised the ultimate clusters of the 1997 RECS sample. An ultimate cluster of housing units to be contacted for interview (averaging 5.6 housing units for the 1997 RECS) was randomly selected by computer from the penultimate cluster; these housing units constituted the assignments given to interviewers.
Population of Special Interest
The 1997 survey featured a supplemental sample of low-income households designed to be merged with the main RECS sample and to meet special analytical needs of the Office of Family Assistance, Family Support Administration (FSA), U.S. Department of Health and Human Services. The FSA is interested in households living below the poverty level.
Procedures for over-sampling this population were based on interviewer observations during the field listing of SSUs. Interviewers were instructed to rate the general income level of each block in the listing segment based on their observations and their general knowledge of the area. Interviewers placed each listing segment into one of four groups: Wealthy (highest 25 percent); Upper-Middle Class (second quartile); Lower-Middle Class (third quartile); or Poor or Near Poor (lowest 25 percent). Whenever possible, interviewers also recorded main heating fuel for each listing segment. Households in the Lower-Middle Class and Poor or Near Poor categories were sampled at a higher rate.
It is not possible to divide the sample into the main sample and supplemental sample, but it is possible to estimate how many observations of various types were added as a result of the supplemental low-income sample.
An estimated 808 interviews were completed in the households selected as part of the low-income supplement. Some 31.8 percent of completed interviews in the supplemental sample were with households living below the poverty level, compared with 14.5 percent of completed interviews in the main sample. The number of households below the Low-Income Home Energy Assistance Program (LIHEAP) level were 57.3 percent of the supplemental sample and 34.1 percent of the main sample.
Household Survey
A complete RECS interview consists of data for a completed household questionnaire and a signed Authorization Form. The large majority of interviews were completed via a Computer Assisted Personal Interviewing (CAPI) system. The survey instrument was programmed by EIA personnel using the BLAISE software system. The paper version of the survey instrument can be found in Form EIA-457A, "Household Questionnaire." Because of early technical problems, some of the initial interviews had to be completed using the paper version of the questionnaire. At the end of each interview, the household respondent was asked to sign an Authorization Form. The signed Authorization Form gave permission for EIA's subcontractor to obtain the housing unit's energy bills from each supplier of energy.
A total of 8,310 housing units were selected to participate in the 1997 RECS. Of these 8,310 households, 7,285 were determined to be eligible to participate. Completed interviews were obtained for 5,902 (81.0 percent) of these eligible households. This section describes the procedures involved in collecting the completed interviews.
Conducting the Interviews
Interviewer Training
In April 1997, two separate three-day training sessions were held in Washington, DC. These sessions were attended by approximately 220 interviewers. Each session was led by a group of trainers who had attended a four-day trainers' workshop in Rockville, MD. All training sessions were monitored by Department of Energy staff.
The Interviewers
A total of 214 interviewers completed one or more personal interviews for this study. Seventy-five interviewers (35 percent) had completed interviews during a prior RECS. The remainder were conducting their first RECS but had prior interviewing experience, either with other survey research organizations or with the U.S. Bureau of the Census.
Interviewers conducted an average of 27 interviews. Four interviewers completed fewer than seven interviews each, with an average of three per interviewer. Fifteen interviewers completed 50 or more interviews each, with an average of 58 per interviewer. Twenty percent of the personal interviews were verified by telephone or mail to ensure that interviews were conducted as intended.
The Interview
Household interviews were conducted with the householder or the householder's spouse and, on average, lasted 29 minutes; nearly 80 percent of the interviews lasted between 15 and 45 minutes. The questions covered energy-related features of the household, such as the type of heating and cooling systems, the fuels used for heating and cooling, household appliances and their usage, the receipt of government assistance for the cost of heating, and demographic data on household members.
Data Collection Dates
Approximately three-quarters of the personal interviews were completed between the middle of April and the middle of June 1997. Ninety-nine percent of the entire sample was completed by mid-August. In a few sample locations with low response rates, interviewing continued through August. In late August, an abbreviated, self-administered version of the household questionnaire was mailed to 1,421 sample households who still had not completed a personal interview. A total of 181 usable mail questionnaires were returned by the end of September 1997. A mail questionnaire was considered usable if the respondent had completed the majority of the questionnaire and the Authorization Form was signed. A follow-up contact was made with all respondents who completed a personal interview and reported paying for at least one fuel but did not complete an authorization form. Attempts were made to secure signed authorization forms from approximately 570 respondents. This follow-up continued through January 1998 and resulted in an additional 95 signed authorization forms.
Data Collection Procedures
In an effort to minimize nonresponse and, therefore, maximize the validity of the survey data, a multiwave, multicontact approach was employed. Before the initial personal contacts, a letter stressing the purpose and importance of the survey was sent to each household with a street address. Beginning in April 1997, interviewers made several callbacks at different times of the day, throughout the week, in an effort to minimize the number of uncontacted households. The interviewers also queried neighbors regarding the most opportune times to contact the prospective respondent.
After initial attempts to complete interviews at the selected housing units were exhausted, field supervisors determined which cases would be reassigned to another interviewer. Types of noninterview households that were reassigned included cases where the householder refused to participate and cases where the householder was not available or not at home. Types of noninterview households that were not reassigned included cases where the householder would be unable to complete an interview during the field period due to absence or illness and cases where the household had moved after the initial contact. Reassignments continued throughout the field period.
Mail follow-up attempts were made at households that had not completed a personal interview. An abbreviated, self-administered version of the questionnaire was mailed to these households with a letter asking that they return the completed questionnaire in the business reply envelope provided. The mailing also included a copy of the Authorization Form for the respondents to fill out and sign. A pen was included with the mailing as an incentive.
After all data collection attempts (both personal interview and the mailed questionnaire), 1,383 households or 19.0 percent of all eligible housing units had not responded.
Table A1 provides a summary of the data collection activities.
Table A1. Data Collection Response Summary for the 1997 RECS
| Units | Mathematical Operand | Subtotals | Totals |
|---|---|---|---|
| Selected Sample Units | 8,310 | ||
| Out-of-Scope Units | minus (-) | 135 | |
| Housing Units | equals (=) | 8,175 | |
| Ineligible Units | minus (-) | 890 | |
| Eligible Units (or number contacted) | equals (=) | 7,285 | |
| Not Completed: | |||
| No One Home | 360 | ||
| Refused | 951 | ||
| Other | 253 | ||
| Subtotal Not Completed | minus (-) | 1,564 | |
| Total Interviews Completed | equals (=) | 5,721 | |
| Mail Questionnaires Completed | plus (+) | 181 | |
| Total Responses | equals (=) | 5,902 | |
| Sources: Energy Information Administration, 1997 Residential Energy Consumption Survey (RECS). | |||
Response Rates and Household Characteristics
Various response and nonresponse rates were compared across Census region, urban status, and housing structure type. Personal interviewers were most successful in the South (81.1 percent) and the Midwest (80.2 percent), in rural areas (85.0 percent), and in single-family and mobile homes (80.5 percent). Conversely, the interviewers had their lowest success rates in the Northeast (73.1 percent), in urban and suburban areas (76.4 percent combined), and in buildings with five or more residential units (72.1 percent). However, when comparing these groups, it is important to remember that their characteristics are not necessarily independent. For example, apartment buildings are concentrated in urban areas.
The total response-rate patterns generally were not affected by including the mailed-questionnaire responses. However, response rates for the mail efforts tended to be higher where the refusal rate to the personal interview was higher.
Data Editing
Data for completed interviews were transferred to the main server at the survey contractor's headquarters via modem. The data were then sent to the survey subcontractor's headquarters for further processing. All paperwork was mailed to the survey subcontractor's headquarters. The paperwork, including the Housing Unit Record Sheet (HURS), the Authorization Form, and the Housing Unit Address Lists were reviewed to ensure that all forms had been completed correctly and that the correct housing unit had been interviewed.
Edits were programmed into the Household Questionnaire and this resulted in far fewer missing data items than in previous surveys. See Appendix B, "Survey Estimates and Data Quality," for more information on this topic.
The subcontractor attempted to resolve inconsistencies or ambiguities in the data by referencing interviewer notes and other parts of the questionnaire. When these efforts failed to resolve important problems, particularly those involving heating fuels or heating equipment and/or relationships between questionnaire responses, the subcontractor made a follow-up telephone contact with the rental agent or with a member of the household in question.
Rental-Agent Survey
The Rental-Agent Survey is an adjunct to the Household Survey and is used to verify information furnished by certain RECS households on fuels used, main heating equipment, how fuels are paid for, and other energy-related topics. Telephone interviews were conducted using Form EIA-457C, "Rental Agents, Landlords, and Apartment Managers Telephone Survey," with the rental agents and landlords of the following types of RECS households: households that did not pay for their fuels, households who paid a third party for their fuel and who rent their living quarters or own and occupy living quarters in a multiunit building.
The interviews with rentals agents or their representatives were conducted in early fall 1997. Altogether, 186 landlords or rental agents were interviewed; these interviews covered 382 households. These 382 households represented 59 percent of the 650 total households who were eligible for inclusion in the Rental Agent Survey.
Comparisons were made between rental agents' and household respondents' reports on their building's year of construction; main space-heating and water-heating fuels; main space-heating equipment; fuel for cooking range; central air-conditioning information; and how the fuels for all of these uses are paid for. Each discrepancy was examined and changes were made to the household data whenever it was judged that the rental agent was more knowledgeable than the household respondent on the different items of information.
Generally, the person who paid for a specific fuel for a specific use was deemed the more knowledgeable person. However, error resolutions were made only after careful examination and consideration of all available sources of information including the rental-agent questionnaire, the household questionnaire, and questionnaires of other households located in the same building. Landlords and rental agents were usually judged more knowledgeable about the year the building was built and the type of main heating equipment; household respondents were typically deemed more reliable sources concerning central air-conditioning and fuel for cooking range.
Confidentiality of Information
EIA does not receive nor take possession of the names or addresses of individual respondents or any other individually identifiable energy data that could be specifically linked with a household respondent; the data are collected for statistical purposes only. All names and addresses and identifiable information are maintained by the survey subcontractor for verification purposes only. The household records that are placed on the public-use data file do not have name or address information. Additional measures have been taken to mask the data for further confidentiality protection. Unlike other EIA surveys, the consumption surveys pledge confidentiality to their respondents.
1997 Data Quality
All the statistics published in this report are estimates of population values, such as the number of households using natural gas. These estimates are based on a randomly chosen subset of the entire population of households. The universe includes all households in the 50 States and the District of Columbia, including households on military installations.
The two major types of nonresponse are unit nonresponse and item nonresponse. Unit nonresponse occurs when a sampled household does not participate in the survey. Item nonresponse occurs when a particular item of interest is missing from a completed questionnaire. The next two sections provide details on the procedures followed for each type of nonresponse.
Adjustments for Unit Nonresponse
Weight adjustment was used to reduce unit nonresponse bias in the survey statistics. Weights were calculated for each sample household. The household weight reflected the selection probability for that household and additional adjustments. These adjustments included correcting for potential biases arising from the failure to list all housing units in the sample area and failure to contact all sample housing units. Contacts were unsuccessful with 19.0 percent of the eligible units.
Six factors are used in the processing of Residential Energy Consumption Survey (RECS) results to develop an overall weight for each household for which a completed questionnaire, either a personal interview or mailed questionnaire, is obtained. The factors are the basic weight, a noninterview adjustment, a first-stage ratio estimate, and three second-stage ratio adjustments. The overall household weight is the product of these six factors.
The Basic Weight
The basic weight is calculated and applied to households at the Secondary Sampling Unit (SSU) level.
Basic Weight = 1/ (Probability of Selection)
For the 1997 RECS, all households in the same SSU had the same probability of selection and hence the same basic weight.
The Noninterview Adjustment
The noninterview adjustment factor (NIAF) compensates for nonresponse households and for nonhousehold units that were identified during the survey. Basically, this adjustment reflects the ratio of the number of completed and uncompleted responses among those selected to the number of completed responses. Since the probabilities of selection are constant within an SSU for 1997, these adjustments were applied at the SSU level.
The NIAF is computed at the SSU and is equal to:
(Total Completed Plus Uncompleted Responses in the SSU / (Completed Responses in the SSU)
If the ratio exceeds 2.0, then the NIAF is set equal to 2.0 and the NIAFs for SSUs in the same Primary Sampling Unit (PSU) and with the same metropolitan status are increased.
The First-Stage Ratio Adjustment Factors
The primary purpose of the first-stage adjustment factor is to reduce the sampling variation in the estimates of the number of housing units by main space-heating fuel resulting from sampling of PSUs during the first stage of the sample design. The correlation between main space-heating fuel and other important energy-related characteristics implies that this adjustment will also reduce the sampling variation for many important variables collected for the RECS.
In some cases, a single PSU comprising all or part of a large metropolitan area was large enough in population to be a stratum by itself. PSUs of this type are called Self-Representing (SR) PSUs because the sample from each SR PSU represents only that PSU. The first-stage ratio adjustment factor was 1.0 for all observations in SR PSUs.
In other strata, one PSU was selected from among two or more PSUs in the stratum. Each of the PSUs selected from these strata is called a Non-Self-Representing (NSR) PSU because each such PSU represents not only itself; it also represents the unselected PSUs in the stratum.
The 1990 Census data were used to determine the difference between the distribution of the main space-heating fuel in the set of selected NSR PSUs and the distribution in the set of all PSUs (selected and unselected) in the strata from which the NSR PSUs are selected. Fuels are under-represented if the percentage of households using the fuel is lower in the selected NSR PSUs than the percentage in the set of all PSUs in the NSR strata. Fuels are over-represented if the opposite occurs. The weights for the responding households in NSR PSUs are adjusted upward when their main space-heating fuel is under-represented and the weights are adjusted downward when it is over-represented.
The Second-Stage Ratio Adjustments
The second-stage ratio adjustments are used to improve the accuracy of the estimates of the number of households using data obtained from the Bureau of the Census as control totals. The RECS can be used to produce an estimate of the number of households in the country, but the Bureau of the Census produces much more accurate estimates. Improving the accuracy of the data on the number of households also improves the accuracy of almost all other estimates obtained from the RECS. The first priority is the accuracy of estimates for the number of households for the nine Census divisions and for the four largest States. The second priority is the accuracy of estimates for the number of households for three demographic cells (multiperson households, single-member female households, and single-member male households).
The ratio adjustment process was carried out in three steps. In step one, the population was divided into 15 geographical cells. (Hawaii and Alaska were treated as separate cells because their climate is different than the rest of the country.) Control totals giving the number of households in each cell were derived from Current Population Survey results. A ratio adjustment equal to the control total divided by the weighted count using the weights after the first-stage ratio adjustment was created. Multiplying the weights after the first-stage ratio adjustment by the ratio yields the new weights which, when summed, equal the control totals for the 15 cells. This calculation yielded a weighted total number of households equal to 101,481,000. Refer to Table B1 for estimates for each of the 15 geographical areas.
The third step is the same as the first step except that the input weights are those resulting from the second step. This produced a set of weights whose sum reproduced the 15 geographic cell control totals and yielded estimates that are quite close to the control totals for the three demographic cells.
Location |
Thousands of Households |
|---|---|
New England |
5,310 |
Middle Atlantic (minus New York State) |
7,597 |
East North Central |
16,907 |
West North Central |
7,153 |
South Atlantic (minus Florida) |
12,764 |
East South Central |
6,344 |
West South Central (minus Texas) |
3,876 |
Mountain |
6,179 |
Pacific (minus Alaska, California, and Hawaii) |
3, 532 |
New York |
6,827 |
Florida |
5,929 |
Texas |
6,964 |
California |
11,484 |
Alaska |
229 |
Hawaii |
386 |
Total United States |
101,481 |
Source: EIA's linear extrapolation from U.S. Bureau of the Census, 1996 and 1997 Current Population Survey. |
|
Adjustments for Item Nonresponse
Item nonresponse occurs when respondents do not know the answer or refuse to answer a question, or when an interviewer does not ask a question or does not record an answer. The incidence of the latter, the interviewer not asking and/or not recording the answer, was greatly reduced by the use of Computer Assisted Personal Interviewing (CAPI). The majority of nonresponse was due to interviewers recording answers of "Don't Know" and "Refused." Some item nonresponse was due to programming problems in the questionnaire. Table B2 lists the most frequently imputed items in the 1997 RECS.
The number of item imputations for the 181 households receiving mail questionnaires was considerable, since these questionnaires contained only a small subset of questions from the household interview. For the mail questionnaires, a modified hot-deck imputation method was used. A hot-deck matrix was created for mail questionnaires and personal-interview households using Census region, type of housing unit structure, space-heating fuel, water-heating fuel, and presence and type of air-conditioning. Whenever possible, a donor personal-interview household was chosen for each mail questionnaire household from the same cell of the hot-deck matrix. For 90 percent of the mail questionnaires, donors matched on all hot-deck variables.
| Imputed Item | Cases Imputed | Percentage of Total Samplea (5,721) |
Method of Imputing | Question Number on Questionnaire |
|---|---|---|---|---|
| Income in past 12 months | 1,016 | 17.8 | Hot deck | J-14a |
| Year home was built | 395 | 6.9 | Hot deck | A-15a |
| Age of water-heating equipment | 348 | 6.1 | Deductive/Hot deck | E-4 |
| Way household used central AC equipment | 297 | 5.2 | Hot deck | F-6a |
| Number of children between the ages of 1 and 12 | 250 | 4.4 | Hot deck | J-1e |
| Number of infants under the age of 1 | 238 | 4.2 | Hot deck | J-1d |
| Way household used Window/Wall AC equipment | 149 | 2.6 | Hot deck | F-11 |
| Use programmable or manual features of thermostat | 126 | 2.2 | Hot deck | F-6b |
| Fuel used to heat hot water | 122 | 2.1 | Hot deck | E-1 |
| Electricity shut off because bill was not paid | 120 | 2.1 | Hot deck | K-4 |
| Could not use heat because ran out of bulk fuel | 120 | 2.1 | Hot deck | K-5a |
| Could not use heat because utility fuel shut off | 199 | 2.1 | Hot deck | K-5b |
| Could not use heat because equipment broken | 119 | 2.1 | Hot deck | K-5c |
| Amount of heat provided by main heating equipment | 108 | 1.9 | Hot deck | D-6 |
| Type of self-cleaning oven | 104 | 1.8 | Hot deck | B-3 |
| Received employment income in last 12 months | 103 | 1.8 | Hot deck | K-1a |
| Received retirement income in last 12 months | 103 | 1.8 | Hot deck | K-1b |
| Received cash benefits in last 12 months | 103 | 1.8 | Hot deck | K-1c |
| Received non-cash benefits in last 12 months | 103 | 1.8 | Hot deck | K-1d |
| Government help in paying home heating costs | 102 | 1.8 | Hot deck | K-2a |
| Government help in paying home cooling costs | 102 | 1.8 | Hot deck | K-2b |
| Government help in paying other home energy costs | 102 | 1.8 | Hot deck | K-2c |
| Amount of wood burning in past 12 months | 97 | 1.7 | Hot deck | H-7d |
| Age of householder | 93 | 1.6 | Allocative | J-9 |
| Amount of heating assistance received | 82 | 1.4 | Hot deck | K-3d |
| Mailed interviews are not included in the percentage. To account for these, add 3 percentage points to the percentage points given. Source: Energy Information Administration, Office of Energy Markets and End Use, Form EIA-457 A of the 1997 Residential Energy Consumption Survey (RECS). RECS Public Use Data Files. |
||||
The use of CAPI techniques allowed EIA to program skip patterns, edit checks, and range checks into the questionnaire. As a result, the quality of the data collected during the interview improved and the amount of time needed to edit and clean the data was reduced. Some of this improvement can be attributed to the fact that the 1997 RECS questionnaire was shorter than the 1993 RECS questionnaire. But the switch to CAPI did result in cleaner data. For example, the data collected during the paper and pencil interviews for the 1993 RECS resulted in 40 variables with more than 100 cases where there were missing data. On the other hand, the data collected during the CAPI interviews for the 1997 RECS resulted in only 22 variables with more than 100 cases where there were missing data.
The questions on both income and year home was built have resulted in a substantial amount of missing data for each RECS. The 1997 RECS was no exception. The large amount of missing data for the age of the water-heating equipment, the number of children, and the number of infants was caused by errors in the skip patterns in the CAPI questionnaire. The plans the 1997 RECS questionnaire included a question concerning the use of evaporative or swamp coolers in housing units located in hot, dry areas of the country and a question concerning the use of automobile block heaters in cold areas of the country, but errors in the skip patterns forced the CAPI instrument to skip these questions for all households.
Quality of Specific Data Items
Housing Unit Type
There is a fine line between the definitions of various types of housing units. The distinction between a single-family attached unit and a unit in an apartment building is particularly complex. The collection and editing of the data on housing type changed from the paper-and-pencil questionnaire for the 1993 RECS to the CAPI questionnaire for the 1997 RECS. The change in the data collection and editing procedures may have contributed to changes in the survey results. For example, the estimated number of occupied single-family attached units increased from 7.3 million for the 1993 RECS to 10.0 million for the 1997 RECS. Conversely, the number of occupied housing units in buildings with two to four units decreased from 8.0 million for the 1993 RECS to 5.6 million for the 1997 RECS.
Programmable (Set-Back or Clock) Thermostats
The 1993 and 1997 RECS both contained questions on the presence of a programmable thermostat. In both surveys, the thermostats were referred to as "set-back or clock thermostats," but not programmable thermostats. For the 1993 RECS, the question was placed in the section on conservation measures and usage (following questions on insulation, weather stripping, and caulking). For the 1997 RECS, it was placed in the space-heating section, immediately following the question on the presence of a thermostat. The 1997 RECS also included a question that asked respondents if they programmed the thermostat or used the manual features. Based on the 1993 RECS, an estimated 10.8 million households had programmable thermostats in 1993. Based on the 1997 RECS, an estimated 33.1 million households had programmable thermostats in 1997. Of these 33.1 million, an estimated 10.2 million programmed their thermostats and an estimated 22.9 million used the manual features.
The large increase in the number of housing units with programmable thermostats from 1993 to 1997 is questionable. The change in the placement of the question may have contributed to the large change in the survey results. In addition, the question concerning programmed versus manual use of the thermostats may have changed how the interviewers coded the question on the presence of a programmable thermostat.
Estimation of Sampling Error
Sampling error is the random difference between a survey estimate and an actual population value. It occurs because the survey estimate is calculated from a randomly chosen subset of the entire population. The sampling error averaged over all possible samples would be zero, but there is only one sample for the 1997 RECS. Therefore, the sampling error is not zero and is unknown for the 1997 RECS sample. However, the sample design permits sampling errors to be estimated. This section describes how the sampling errors were estimated and how they were made available to readers of this report who are interested in the precision of the estimates in this report.
Throughout this report, standard errors are given as percents of their estimated values; that is, as relative standard errors (RSE). The RSE is also known as the coefficient of variation.
For a given population parameter Y that is estimated by the survey statistic Y, the relative standard error of Y, RSE(Y), and standard error of Y, S(Y), are given by:
RSE(Y) = [S(Y)/Y] × 100.
S(Y) = [RSE(Y)/100] × Y.
For some surveys, a convenient algebraic formula for computing variances can be obtained. However, the RECS used a multistage area sample design of such complexity (see Appendix A, "How the Survey Was Conducted") that it is virtually impossible to construct an exact algebraic expression for estimating variances. In particular, convenient formulas based on an assumption of simple random sampling, typical of most standard statistical packages, are inappropriate for the RECS estimates. Such formulas tend to give low values for standard errors, making the estimates appear much more accurate than is the case. Instead, the method used to estimate sampling variances for this survey was balanced half-sample replication. The balanced half-sample replication method involves calculating the value for a statistic using the full sample and calculating the value for each of a systematic set of half samples. (Each half sample contains approximately one-half of the observations contained in the full sample.) The variance is estimated using the differences between the value of the statistic calculated using the full sample and the values of the statistic calculated using each of the half samples.
Generalized Variances
For every estimate in this report, the RSE was computed by the balanced half-sample replication method. This RSE was used for any statistical tests or confidence intervals given in the text, or to determine if the estimate was too inaccurate to publish (RSE greater than 50 percent).
Space limitations prevent publishing the complete set of RSEs with this document. Instead, a generalized variance technique is provided, by which the reader can compute an approximate RSE for each of the estimates in the detailed tables. For the statistic in the ith row and jth column of a particular table, the approximate RSE is given by:
RSE(i,j) = R(i) × C(j)
where R(i) is the RSE row factor given in the last column of row i, and C(j) is the RSE column factor given at the top of column j. This value for the relative standard error can be used to construct confidence intervals and to perform hypothesis tests by standard statistical methods. However, because the generalized variance procedure gives only approximate RSEs, such confidence intervals and statistical tests must also be regarded as only approximate.
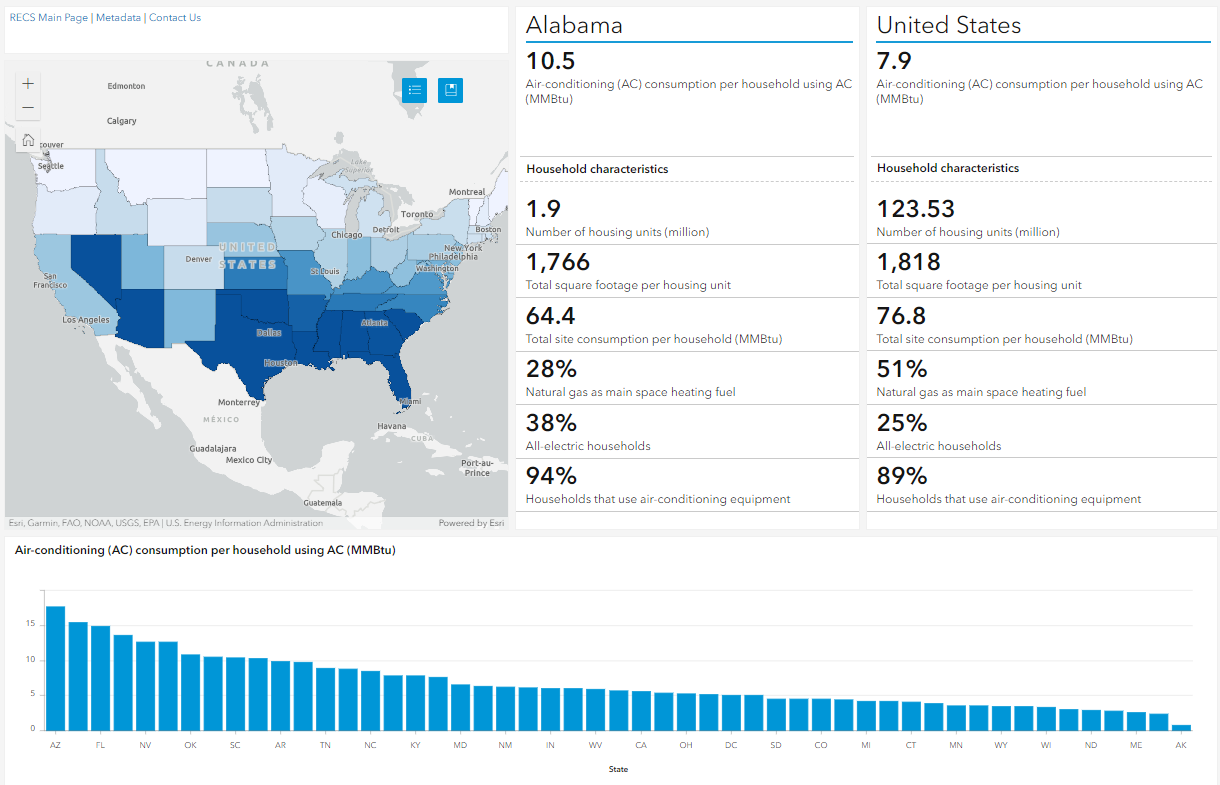 View the dashboard ›
