Increased solar and wind electricity generation in California are changing net load shapes
Republished December 9, 2014, 12:10 p.m. to clarify text, correct graph
As more solar and wind electric generating capacity is added in California, the California Independent System Operator (CAISO), the electric grid operator for most of the state, is facing an increasingly different net load shape. Net load—the total electric demand in the system minus wind and solar generation—represents the demand that CAISO must meet with other, dispatchable sources such as natural gas, hydropower, and imported electricity from outside the system.
Wind and solar plants do not incur any fuel costs to generate electricity, and, when available, they are among the first resources that grid operators use. Utility-scale solar has exhibited particularly significant growth in the past year, with hourly solar output reaching nearly 5 gigawatts (GW) by the end of September 2014. This amount represents more than 10% of the system's 2014 year-to-date hourly peak demand, and it is more than two-thirds higher than the peak hourly solar output level in 2013.
This capacity does not include smaller-scale (e.g., residential) distributed photovoltaic (PV) capacity that does not participate directly in CAISO's market. However, such behind-the-meter capacity impacts both the load and net load shape by reducing the overall system demand during periods when the sun is shining. The Solar Energy Industries Association estimated approximately 1.2 GWAC (1.4 GWDC) of residential capacity was installed in California through the second quarter of 2014, as well as a similar level of non-residential, non-utility installations—although CAISO data may partially account for the latter depending on individual interconnection arrangements.
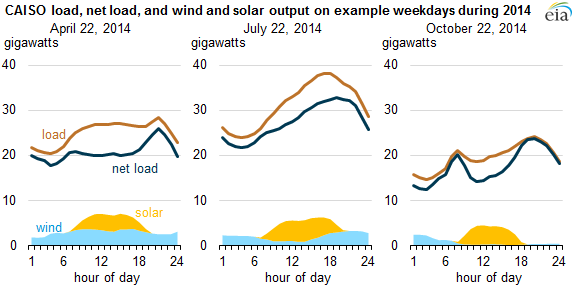
Generation from solar units tends to coincide with electricity demand, producing electricity during daylight hours and achieving maximum output around midday. In the summer, when CAISO's load shape is driven by the demand for cooling, electricity demand tends to have a single peak in midafternoon. Solar output reduces the effective peak demand—and therefore reduces the generation needed from dispatchable units.
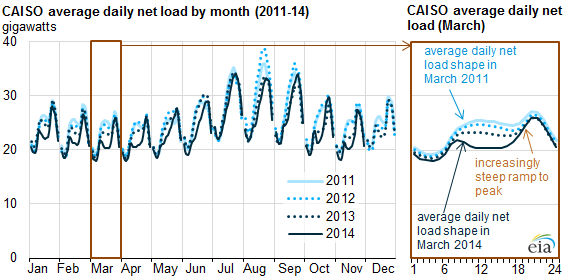
Electricity demand in nonsummer months (with lower cooling demand) tends to have a different shape. Both overall and peak demand tend to be lower, and it is common to see both an upward morning ramp and a higher peak in the early evening as people return home from work. Solar-generated electricity lowers the net load at midday, but as the sun goes down and solar generation declines, there is a much steeper ramp in net load to meet the peak demand in the evening. The emergence of this pattern was quite visible in the months of fall 2013 through spring 2014.
CAISO officials have projected this shift in net load and expect the trend to become more pronounced as more solar and wind capacity is added to meet the state's 33%-by-2020 renewable portfolio standard. California's changing net load patterns are expected to create a greater need for flexible, dispatchable capacity to manage operational and reliability challenges. The anticipated need for additional flexibility in CAISO could be amplified, as 17.5 GW of thermal generating capacity is impacted by the State Water Resources Control Board's once-through cooling requirements.
In the past few years, California's legislature, public utilities commission, and CAISO have initiated the following policies and frameworks that could mitigate challenges associated with this changing net load shape.
- Increased focus on flexible resources. The California Public Utilities Commission (CPUC) has adopted a flexible capacity framework to start in 2015, requiring CPUC-jurisdictional load serving entities (LSEs) to procure a certain level of flexible capacity when meeting resource adequacy needs. In addition, CAISO implemented a flexible ramping constraint in its real-time market at the end of 2011, which allowed for the procurement of upward ramping capability from online resources to meet ramping needs in real time. CAISO is further considering introducing upward and downward ramping products into its market processes, including the day-ahead market.
- Storage mandate. CPUC has mandated that the state's three investor-owned utilities procure 1.325 GW of energy storage at various interconnection levels (transmission, distribution, customer-sited) by 2020.
- Market design enhancements for intra-hour scheduling. On May 1, 2014, CAISO implemented a 15-minute market for generators, imports, exports, and participating loads as part of its compliance with Federal Energy Regulatory Commission Order No. 764, which required intra-hour scheduling options to aid the integration of renewable resources into the grid.
- Creation of an energy imbalance market. On November 1, 2014, CAISO and PacifiCorp formally launched an energy imbalance market (EIM) between the two balancing authorities (to be expanded to also include NV Energy in October 2015) to create a market mechanism that is effectively able to use the generation resources of both balancing authorities, utilizing a more diverse set of resources to address short-term supply and demand imbalances.
- Time-of-use pricing. California has enacted legislation enabling the CPUC to authorize utilities to default (with the option to opt out) residential customers to a time-of-use rate schedule starting in 2018. Under time-of-use rates, customers' time-varying rates will reflect variation in the cost of generation (unlike traditional rate structures), and may be more likely to shift consumption hours away from periods when peak generation is required from dispatchable units, thereby reducing the amount of resources necessary to meet load.
- Demand response. California enacted legislation in September 2014 directing the CPUC to include demand response in its assessment of resource adequacy requirements and to establish a set of rules and tariff policies to encourage the efficient and cost-effective deployment of demand response resources.
Principal contributors: Gwen Bredehoeft, Eric Krall