The United Kingdom’s natural gas supply mix is changing
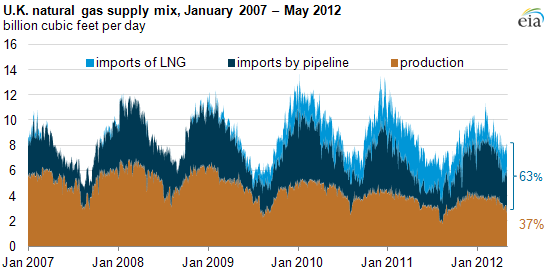
Note: Daily pipeline imports are reported on a net basis, or imports minus exports.
Natural gas production in the United Kingdom is trending down due to declines in production from that country's North Sea fields. Imports via pipeline connections with Europe as well as seaborne deliveries of liquefied natural gas (LNG) now account for more than half of the U.K.'s natural gas supply.
Here are some key findings underpinning supply trends.
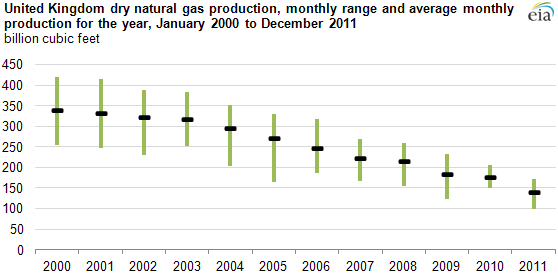
U.K. Production
Natural gas production in the U.K. has been falling for years. Average monthly U.K. natural gas production has fallen from around 350 billion cubic feet (Bcf) per month in 2000 to less than 200 Bcf per month in 2011. Natural gas production in the U.K. declined 22% between 2010 and 2011. Natural gas reserves have been steadily declining since 1999 as well; older fields account for a significant volume of current natural gas production in the U.K. The vast majority of U.K. production comes from offshore fields, and in 2010, 85% of gross offshore production came from fields that had been producing for more than 10 years, and 39% of gross offshore natural gas production came from fields that started flowing natural gas prior to 1991.
Pipeline Imports
U.K. annual pipeline imports from Norway rose significantly in recent years, up from just 36 Bcf in 2001 to 878 Bcf in 2010. Most of the growth since October 2006 is attributable to the Langeled Pipeline, which began service that month. Extending 725 miles through the North Sea, the Langeled Pipeline links the Nyhamna terminal in Norway via the Sleipner Riser platform in the North Sea to the Easington Gas Terminal in the U.K. From January 1, 2012 through May 17, 2012, imports from Norway on the Langeled Pipeline averaged about 2.5 billion cubic feet per day (Bcf/d). Earlier imports from Norway were directly from North Sea fields owned by Norway.
Since 2007, the U.K. has been a net importer of natural gas from Continental Europe via the Interconnector and BBL pipelines, as annual imports on these pipelines have exceeded annual exports. From January 1—May 17, 2012, net imports into the U.K. from Belgium and the Netherlands, together, have averaged about 1 Bcf/d. Natural gas flows between the U.K. and Belgium and the Netherlands vary depending on market conditions. When demand is peaking in the U.K., gas flows into the U.K.; when the U.K. is well-supplied with natural gas relative to demand, natural gas tends to flow into Europe from the U.K. Analysts can observe these changes daily; National Grid, the principal natural gas pipeline operator in the U.K., provides real-time estimates of natural gas flows at key import locations on its website.
LNG Imports
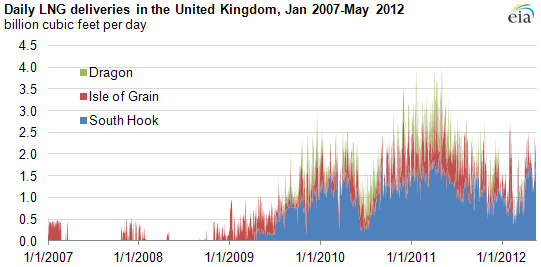
The U.K. has not been dependent on LNG for long. The first modern-era LNG terminal in the U.K.—the Isle of Grain terminal—began commercial service in the summer of 2005. LNG's role, however, has grown significantly since then. At times, LNG deliveries in the U.K. have provided up to 4 Bcf/d of total supply and accounted for 20% of the U.K.'s aggregate natural gas needs (see chart below). In the United States, only the New England region is as reliant on contributions from LNG to meet demand.
In 2011, total U.K. LNG imports exceeded 900 Bcf, with Qatar accounting for over 80% of U.K.'s LNG imports that year. Average daily LNG deliveries from re-gasification terminals have trailed off to 1.4 Bcf/d so far in 2012 (January 1 through May 17) compared with 2.7 Bcf/d for the same period in 2011. Since 2009, the South Hook terminal has received most of the LNG imports into the U.K. (see chart below).