Global energy intensity continues to decline
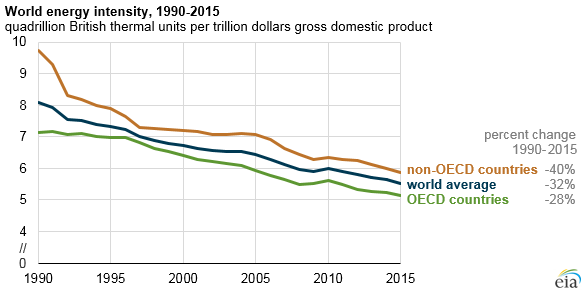
Note: OECD is the Organization for Economic Cooperation and Development. Gross domestic product calculated in purchasing power parity terms.
Worldwide energy intensity, measured as energy consumption per unit of gross domestic product (GDP), decreased by nearly one-third between 1990 and 2015. Energy intensity has decreased in nearly all regions of the world, with reductions in energy intensity occurring both in the more developed economies of the Organization for Economic Cooperation and Development (OECD) and in the emerging nations of the non-OECD.
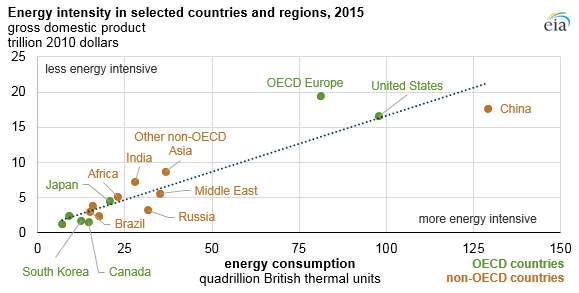
Differences in energy intensity across countries and regions correspond to underlying factors such as economic structure, climate, and geography. Manufacturing-focused economies tend to use more energy per dollar of GDP than service-focused economies. Countries and regions with wider temperature variations tend to use more energy for heating and cooling. The distances between urban areas—and the infrastructure within them—can influence the amount of energy used to move goods and passengers.
Historically, energy intensity levels in non-OECD countries have been higher than levels in OECD countries. In many non-OECD countries, economies have been industrializing and rely on more energy-intensive forms of energy use. In contrast, many OECD countries have transitioned from relying on energy-intensive manufacturing to using more services-based economic activities that are less energy intensive. Based on 2015 estimates, OECD countries used on average 12% less energy per dollar of GDP than non-OECD countries.
Energy efficiency policies also differ among different regions of the world, with the relative efficiency of buildings, vehicles, and industrial processes heavily influenced by the local regulations, incentives, and market competition. For example, according to the International Council on Clean Transportation, fuel economy standards are applied in approximately 80% of the world automobile market. The remainder of the world, while potentially influenced by regulated markets, lacks local efficiency standards. Building energy efficiency policies can also differ significantly across countries. Countries with more developed economies generally tend to have more stringent regulations on energy use and energy efficiency.
Note: OECD is the Organization for Economic Cooperation and Development. Gross domestic product calculated in purchasing power parity terms.
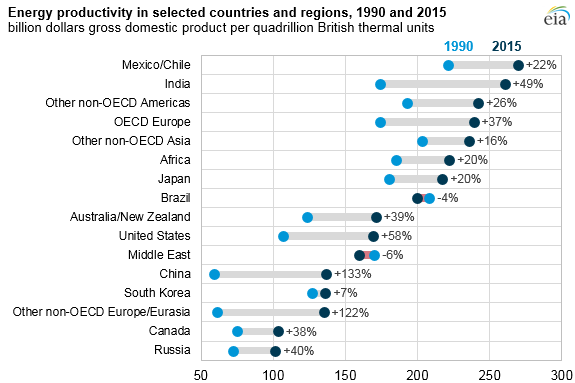
Energy productivity, or the amount of economic output for each unit of energy consumed, is inversely related to energy intensity. Within a region over time, several factors contribute to rising energy productivity:
- Structural changes in production and consumption (from manufacturing to service economies)
- More efficient use of resources
- Outsourcing energy-intensive activities
Between 1990 and 2015, China experienced the largest increase in energy productivity (133%) as a large increase in economic output was more than double the increase in energy consumption. During the same time period, U.S. energy productivity rose by 58%, with improvements in every sector.
Note: Gross domestic product calculated in purchasing power parity terms.
Principal contributor: Ari Kahan
Tags: consumption/demand, efficiency, international, OECD