Recent trends in energy-related CO2 emissions vary across regions and states
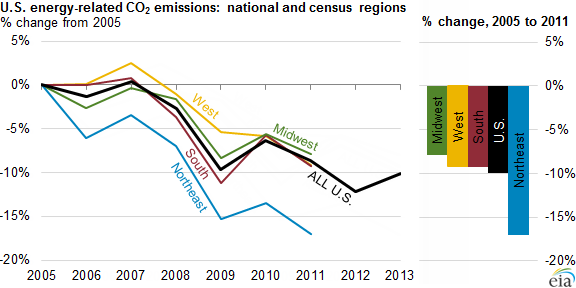
U.S. energy-related carbon dioxide (CO2) emissions in 2013 were 10% below the benchmark year of 2005. Emissions in 2013 were roughly 2% above their 2012 level and 1.5% below their 2011 level, when emissions were 8.6% below the 2005 level. Recently released state-level data through 2011, calculated from the State Energy Data System (SEDS) and aggregated here by Census regions, show different parts of the country generally experiencing this downward trend, but at variable rates by region.
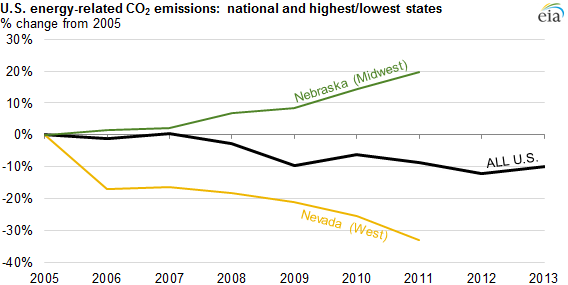
Between 2005 and 2011, all four Census regions—West, South, Midwest, and Northeast—experienced emissions declines, with the Northeast experiencing larger emissions reductions than the other regions. Underlying state-level emissions changes spanned an even wider range, from a 20% emissions increase in Nebraska (Midwest) to a 33% decrease in Nevada (West). Regional and subregional spreads reflect differences in local energy economics, population distribution, and other factors.
Drivers of faster, larger emissions declines in the Northeast include extensive urbanization, translating into denser, more energy-efficient population centers, and increasingly low-carbon electricity generation from natural gas, nuclear, and renewables, instead of coal. The Northeast includes the top-three lowest emitting states per unit of economic output (New York, Connecticut, and Massachusetts) and two of the top-five states with the cleanest electricity sources (Vermont and New Hampshire).
Compared to the Northeast, the other regions (Midwest, West, and South) have more diverse state-level characteristics, which contributed to relatively slower net emissions declines. Steep emissions reductions in some states were partially offset by escalating emissions elsewhere. For example, states like Wyoming (West), North Dakota (Midwest), and West Virginia (South) have more carbon-intensive energy production, higher and less efficient energy use in more sparsely populated areas, and heavily coal-reliant electricity generation compared to other states in those regions. Since 2009, factors driving the uptick in Nebraska's emissions profile included marked expansion of the biofuels (corn-based ethanol) industry, as well as increased production of crude oil and the temporary closure of the Fort Calhoun nuclear power plant. Conversely, Nevada's lower-bounding trend shows the effects of substantially decarbonizing its electric power sector—between 2005 and 2011, Nevada significantly reduced its coal use, while increasing solar and geothermal use.
Earlier this week, the Environmental Protection Agency (EPA) issued a proposed rule that would require reductions in carbon dioxide emissions from existing fossil-fueled electric power plants. The EPA proposal includes emission rate targets for each state, measured as pounds of carbon dioxide emissions per megawatthour of covered generation, as well as guidelines for the development, submission, and implementation of state plans. The emission rate targets vary significantly across individual states, reflecting the application of a series of common building blocks to states with widely different starting points in their respective electricity markets.
Principal contributor: Yanna Antypas