In the News:
Growing ethane demand means less left in natural gas pipelines
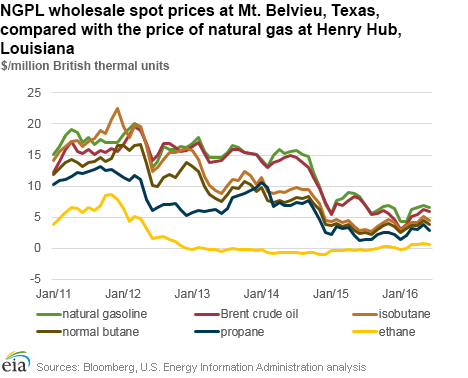
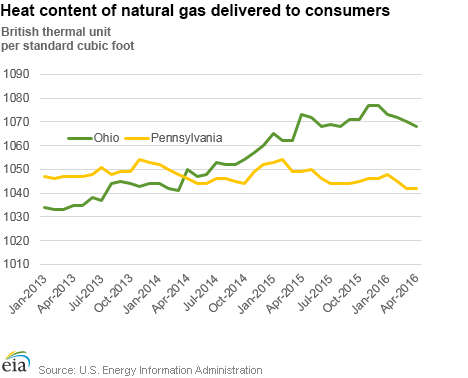
The price of ethane averaged $3.14 per million British thermal units (MMBtu) during June 2016, 18% higher than the average price of natural gas at the Henry Hub over that period. Ethane prices had been at or below natural gas prices from late 2012 through the beginning of 2016, as ethane demand and infrastructure growth lagged supply increases. Since January 2016, there have been indications that the portion of ethane recovered as a percent of total natural gas plant liquids (NGPL) produced has generally been increasing, while the heat content of natural gas delivered to consumers, an indicator of NGPL-content (primarily ethane) in pipeline gas, has been declining.
Recovery of ethane from unprocessed natural gas can be at the discretion of gas processing plant operators. Unlike heavier natural gas plant liquids, such as propane, butanes, and natural gasoline, ethane can remain in the processed gas that is transported on interstate pipelines. The extent to which processing plants extract ethane and other NGPL are influenced by their price compared with processed natural gas (on an energy-equivalent basis) and local market dynamics.
The uptick in ethane prices this year coincided with higher ethane consumption by the petrochemical industry on the U.S. Gulf Coast, indicated by strong increases in ethane product supplied in Petroleum Administration for Defense District 3 (PADD 3) since November 2015. Furthermore, in early March 2016 the Sunoco ethane export terminal at Marcus Hook, Pennsylvania, began operations, providing producers in the area with an additional market outlet for 35,000 barrels per day (b/d) of ethane. U.S. export capacity is expected to grow further in the third quarter of this year, when Enterprise Products Partners commissions its ethane export terminal in Morgan's Point, Texas, which has a planned 200,000 b/d capacity. By comparison, total U.S. ethane production in April 2016 averaged 1.3 million barrels per day (MMb/d).
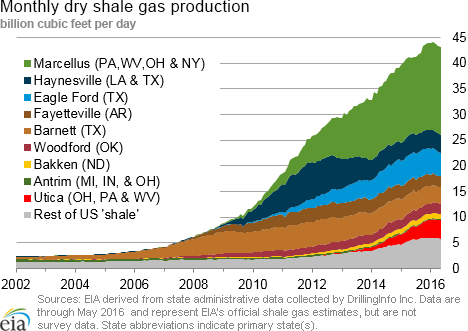
By selling NGPL separately from natural gas, producers gain additional revenue and increased incentive to drill for natural gas. The shift in U.S. natural gas production to tight and shale gas formations, which in general yield higher NGPL output, has been a driving force behind the 57% increase in U.S. NGPL production from 2.1 MMb/d in 2010 to 3.3 MMb/d in 2015. EIA's Annual Energy Outlook 2016 (AEO2016) Reference case projects U.S. production of NGPL to reach 5.0 MMb/d by 2040. This reflects expectations of further growth in NGPL demand, as well as recovery in oil prices and the associated recovery in NGPL prices.
Overview:
(For the Week Ending Wednesday, July 6, 2016)
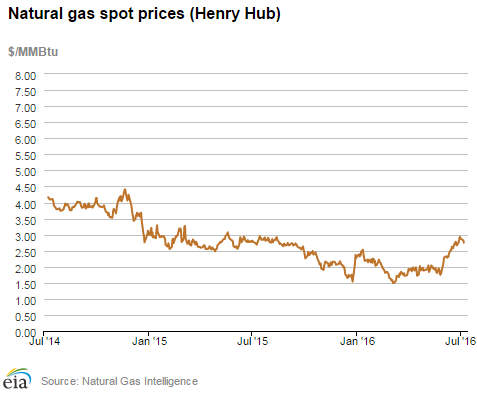
- Natural gas spot prices fell at most locations this report week (Wednesday, June 29, to Wednesday, July 6). The Henry Hub spot price ended five weeks of increases, falling by 18¢ from $2.93/MMBtu last Wednesday to $2.75/MMBtu yesterday.
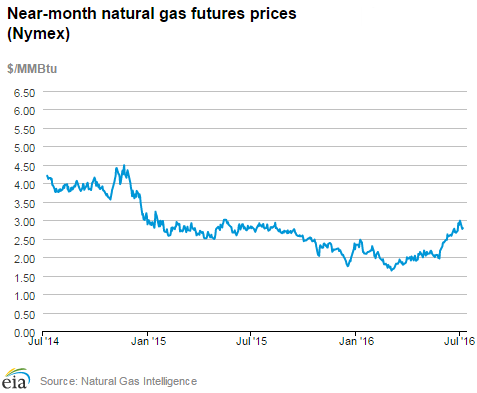
- At the New York Mercantile Exchange (Nymex), the August 2016 contract also declined, falling from $2.863/MMBtu last Wednesday to $2.786/MMBtu yesterday.
- Net injections to working gas totaled 39 billion cubic feet (Bcf) for the week ending July 1. Working gas stocks are 3,179 Bcf, which is 20% above the year-ago level and 23% above the five-year (2011-15) average for this week.
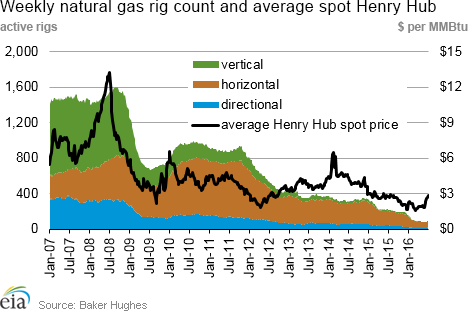
- According to Baker Hughes, for the week ending Friday, July 1, the natural gas rig count declined by 1 to 89. Oil-directed rigs increased by 11 to 341, the largest weekly increase in the rig count since December 2015. The total rig count increased by 10 over the week.
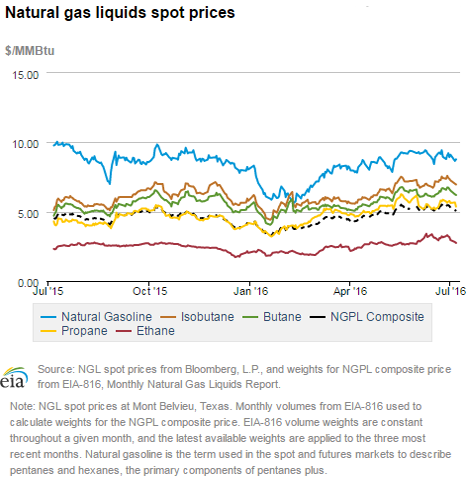
- The natural gas plant liquids composite price at Mont Belvieu, Texas, rose by 3¢, closing at $5.41/MMBtu for the week ending July 1. The price of natural gasoline fell 2%, but the prices of all of the other natural gas liquids products rose. Propane and isobutane each rose by 1%; and butane and ethane rose by 2%.
Prices/Supply/Demand:
Spot prices decline. This report week (Wednesday, June 29, to Wednesday, July 6), the Henry Hub spot price fell 18¢ from $2.93/MMBtu last Wednesday to $2.75/MMBtu yesterday. At the Chicago Citygate, prices fell 19¢ from $2.86/MMBtu last Wednesday to $2.67/MMBtu yesterday. Prices at PG&E Citygate in California fell 60¢ from $3.26/MMBtu last Wednesday to $2.66/MMBtu yesterday. Prices fell in California as temperatures moderated.
Northeast market prices rise. As weather moderated on the West Coast, temperatures increased in the East over the last few days of the report week. At the Algonquin Citygate, which serves Boston-area consumers, prices rose 64¢ from $2.92/MMBtu last Wednesday to $3.56/MMBtu yesterday. On Tuesday, New York prices rose more than $1/MMBtu. At the Transcontinental Pipeline's Zone 6 trading point for New York, prices rose 77¢ from $2.08/MMBtu last Wednesday to $2.85/MMBtu yesterday.
Marcellus prices decline. The Tennessee Zone 4 Marcellus price fell 19¢ from $1.65/MMBtu last Wednesday to $1.46/MMBtu yesterday. The price at Dominion South in northwest Pennsylvania fell 24¢ from $1.79/MMBtu last Wednesday to $1.55/MMBtu yesterday.
Nymex prices decline. At the Nymex, the price of the August 2016 contract fell from $2.863/MMBtu last Wednesday to $2.786/MMBtu yesterday. Earlier this week, the August contract settled at $2.987/MMBtu, its highest price in more than a year, before falling more than 20¢ on Tuesday. The price of the 12-month strip (the average of the 12 contracts between August 2016 and July 2017) fell slightly, from $3.095/MMBtu to $3.075/MMBtu.
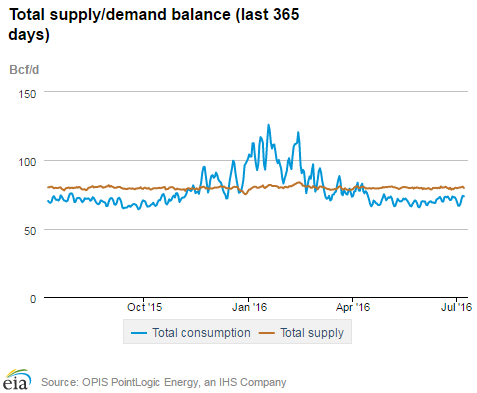
Supply rises. According to data from PointLogic, total supply of natural gas rose by 1% over the report week. This was driven by a 1% increase in dry natural gas production over the report week. Average net imports from Canada fell by 2% from last week. Liquefied natural gas (LNG) pipeline deliveries remained the same as last week, but remained a small contributor to overall supply.
Consumption falls. During the report week, total U.S. consumption of natural gas fell by 4%, according to data from PointLogic. Power burn fell by 5% week over week. Industrial–sector consumption fell by 1% week over week. In the residential and commercial sectors, consumption fell by 8%. Natural gas exports to Mexico were the same as last week, averaging 3.7 Bcf/d.
U.S. LNG exports rise. The natural gas pipeline flows to the Sabine Pass liquefaction terminal averaged 0.66 Bcf/d, 48% higher than last week. One vessel (LNG-carrying capacity 3.0 Bcf) departed the Sabine Pass terminal on July 1.
Storage:
Working gas rises in Lower 48 despite withdrawals in Pacific and South Central regions. Net injections into storage totaled 39 Bcf during the storage report week, compared with the five-year (2011-15) average of 77 Bcf and last year's net injection of 83 Bcf during the same week. As a result, the divergence in storage compared with the five-year average declined from the previous week to 599 Bcf, and the gap compared with year-ago levels decreased to 538 Bcf. The Pacific and South Central regions each posted net withdrawals for the second week in a row.
The storage overhang in the Pacific region falls to 10 Bcf. Working gas stocks in the Pacific region are only 10 Bcf above the five-year average, after starting the refill season on April 1 with a 60–Bcf surplus. The shut-in of the Aliso Canyon storage field in Southern California likely contributed to the narrowing of this gap. On January 21, the California Public Utilities Commission mandated that working gas stocks not exceed 15 Bcf at Aliso Canyon. The Aliso Canyon storage field constitutes 86 Bcf of Southern California Gas's 130 Bcf of working gas capacity. The Pacific region is the only region in the Lower 48 states that is currently below last year's level.
Rising spot prices continue to reduce spread to the January futures price. During the most recent storage week, the average natural gas spot price at the Henry Hub was $2.82/MMBtu, while the Nymex futures price of natural gas for delivery in January 2017 averaged $3.38/MMBtu, a difference of 56¢/MMBtu. A year ago, the premium was 47¢/MMBtu. The average Henry Hub price so far in the injection season this year, from April 1 to July 1, was $2.14/MMBtu, 22% lower than the average value of $2.73/MMBtu for the same period last year. Earlier during the refill season the premium exceeded $1/MMBtu.
Stock change is on the low end of analyst expectations. Expected net injections for the week ranged from 35 to 50 Bcf, with a median of 42 Bcf. Prices for the Nymex futures contract for August delivery at the Henry Hub rose about 2¢/MMBtu to $2.83/MMBtu, with 500 contracts traded at the release of EIA's Weekly Natural Gas Storage Report. Prices rose somewhat in subsequent trading, reaching $2.84/MMBtu within two minutes of the release.
Rising temperatures boost cooling demand for natural gas. Temperatures in the Lower 48 states averaged 75°F during the storage report week. Temperatures during the report week were above normal throughout most of the Lower 48 states, on average by 3%, and were 3% above last year at this time. This week marked the fifth week in a row that cooling degree-days in the Lower 48 states exceeded the normal level. Cooling degree-days in the Lower 48 states since the beginning of the refill season on April 1 were 19% above normal.
See also:

| Spot Prices ($/MMBtu) | Thu, 30-Jun |
Fri, 1-Jul |
Mon, 4-Jul |
Tue, 5-Jul |
Wed, 6-Jul |
|---|---|---|---|---|---|
| Henry Hub | 2.90 |
2.87 |
Holiday |
2.82 |
2.75 |
| New York | 1.87 |
1.57 |
Holiday |
2.66 |
2.85 |
| Chicago | 2.80 |
2.74 |
Holiday |
2.72 |
2.67 |
| Cal. Comp. Avg.* | 2.81 |
2.63 |
Holiday |
2.55 |
2.41 |
| Futures ($/MMBtu) | |||||
| August Contract | 2.924 |
2.987 |
Holiday |
2.764 |
2.786 |
| September Contract | 2.918 |
2.981 |
Holiday |
2.758 |
2.777 |
| *Avg. of NGI's reported prices for: Malin, PG&E Citygate, and Southern California Border Avg. | |||||
| Source: NGI's Daily Gas Price Index | |||||
| U.S. natural gas supply - Gas week: (6/30/16 - 7/6/16) | |||
|---|---|---|---|
Average daily values (Bcf/d): |
|||
this week |
last week |
last year |
|
| Marketed production | 81.0 |
80.0 |
82.1 |
| Dry production | 73.5 |
72.6 |
74.1 |
| Net Canada imports | 6.4 |
6.5 |
6.1 |
| LNG pipeline deliveries | 0.2 |
0.2 |
0.2 |
| Total supply | 80.1 |
79.3 |
80.4 |
|
Source: OPIS PointLogic Energy, an IHS Company | |||
| U.S. natural gas consumption - Gas week: (6/30/16 - 7/6/16) | |||
|---|---|---|---|
Average daily values (Bcf/d): |
|||
this week |
last week |
last year |
|
| U.S. consumption | 59.1 |
61.5 |
58.1 |
| Power | 32.3 |
34.0 |
30.1 |
| Industrial | 19.5 |
19.6 |
19.5 |
| Residential/commercial | 7.3 |
7.9 |
8.5 |
| Mexico exports | 3.7 |
3.7 |
3.2 |
| Pipeloss fuel use/losses | 6.4 |
6.8 |
6.3 |
| LNG pipeline receipts | 0.7 |
0.4 |
- |
| Total demand | 69.8 |
72.5 |
67.7 |
|
Source: OPIS PointLogic Energy, an IHS Company | |||
| Rigs | |||
|---|---|---|---|
Fri, July 01, 2016 |
Change from |
||
last week |
last year |
||
| Oil rigs | 341 |
3.3% |
-46.7% |
| Natural gas rigs | 89 |
-1.1% |
-59.4% |
| Miscellaneous | 1 |
0.0% |
-66.7% |
| Rig numbers by type | |||
|---|---|---|---|
Fri, July 01, 2016 |
Change from |
||
last week |
last year |
||
| Vertical | 61 |
15.1% |
-43.5% |
| Horizontal | 332 |
2.2% |
-49.5% |
| Directional | 38 |
-11.6% |
-60.8% |
| Source: Baker Hughes Inc. | |||
| Working gas in underground storage | ||||
|---|---|---|---|---|
Stocks billion cubic feet (Bcf) |
||||
| Region | 2016-07-01 |
2016-06-24 |
change |
|
| East | 654 |
632 |
22 |
|
| Midwest | 764 |
742 |
22 |
|
| Mountain | 202 |
198 |
4 |
|
| Pacific | 313 |
315 |
-2 |
|
| South Central | 1,246 |
1,253 |
-7 |
|
| Total | 3,179 |
3,140 |
39 |
|
| Source: U.S. Energy Information Administration | ||||
| Working gas in underground storage | |||||
|---|---|---|---|---|---|
Historical comparisons |
|||||
Year ago (7/1/15) |
5-year average (2011-2015) |
||||
| Region | Stocks (Bcf) |
% change |
Stocks (Bcf) |
% change |
|
| East | 575 |
13.7 |
594 |
10.1 |
|
| Midwest | 572 |
33.6 |
604 |
26.5 |
|
| Mountain | 157 |
28.7 |
149 |
35.6 |
|
| Pacific | 330 |
-5.2 |
303 |
3.3 |
|
| South Central | 1,007 |
23.7 |
931 |
33.8 |
|
| Total | 2,641 |
20.4 |
2,580 |
23.2 |
|
| Source: U.S. Energy Information Administration | |||||
| Temperature -- heating & cooling degree days (week ending Jun 30) | ||||||||
|---|---|---|---|---|---|---|---|---|
HDD deviation from: |
CDD deviation from: |
|||||||
| Region | HDD Current |
normal |
last year |
CDD Current |
normal |
last year |
||
| New England | 2
|
-2
|
-13
|
33
|
8
|
21
|
||
| Middle Atlantic | 1
|
-1
|
-5
|
49
|
9
|
27
|
||
| E N Central | 6
|
3
|
-6
|
45
|
0
|
27
|
||
| W N Central | 2
|
-3
|
0
|
66
|
8
|
11
|
||
| South Atlantic | 0
|
0
|
0
|
97
|
10
|
9
|
||
| E S Central | 0
|
0
|
0
|
101
|
18
|
23
|
||
| W S Central | 0
|
0
|
0
|
125
|
11
|
12
|
||
| Mountain | 1
|
-11
|
1
|
87
|
20
|
-14
|
||
| Pacific | 2
|
-7
|
2
|
64
|
32
|
-14
|
||
| United States | 2
|
-2
|
-2
|
74
|
12
|
11
|
||
|
Note: HDD = heating degree-day; CDD = cooling degree-day Source: National Oceanic and Atmospheric Administration | ||||||||
Average temperature (°F)
7-Day Mean ending Jun 30, 2016
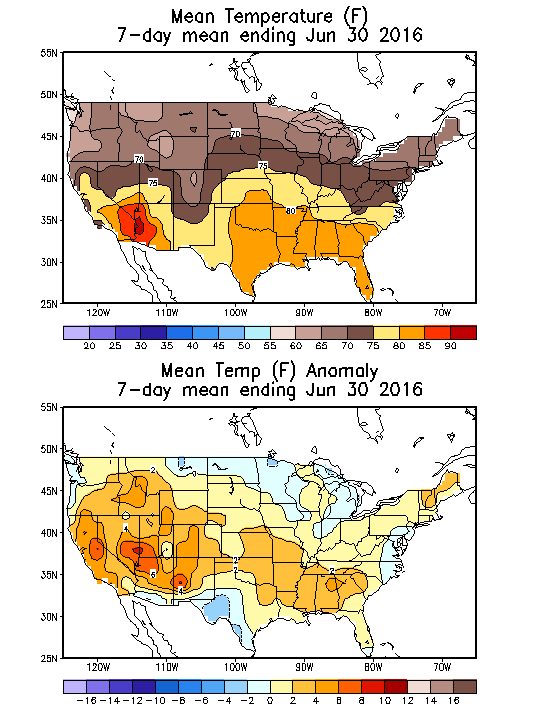
Source: NOAA/National Weather Service
Deviation between average and normal (°F)
7-Day Mean ending Jun 30, 2016
Source: NOAA/National Weather Service