In the News:
Natural gas storage injections in 2016 ahead of 2012 pace
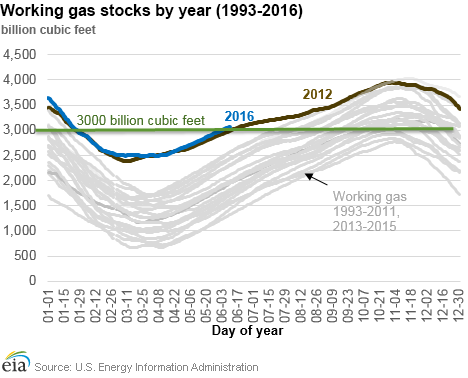
Working gas stocks topped 3,000 billion cubic feet (Bcf) during the first week of June—earlier in the refill season (April 1 – October 31) than ever before. The last time stocks reached this threshold in June was during the week ending June 15, 2012. Comparable to 2012, working gas stocks entered the refill season this year at a record high level, totaling 2,492 Bcf on March 31, 19 Bcf above the previous 2012 record.
Natural gas production, consumption, and exports are considerably higher now compared with 2012. Despite these changes in the fundamentals, the relationship between the key factors determining the rate of injections into working gas remain intact. Although working gas stocks typically end the refill season within 200 Bcf of the previous five-year average, the pace of injections to reach that level can vary considerably, depending in large part on where working gas stocks start the refill season. The amount of gas in underground storage at the start of the refill season has ramifications for natural gas consumption, exports, production, and prices in the ensuing months. As in 2012, a high April 1 starting point and stronger than average power sector consumption contributed to lower than average weekly net injections.
Demand for natural gas remains robust during the 2016 refill season. Total natural gas consumption during this period has exceeded both year-ago and 2012 levels, a trend driven by growth in power-sector consumption. At 26 billion cubic feet per day (Bcf/d), power burn is at a record high for this time of year, 10% greater than year-ago levels and 5% above the level reported in 2012. Growth in exports has also contributed to increases in natural gas demand. Exports to Mexico have more than doubled since 2012 to 4 Bcf/d, and liquefied natural gas (LNG) exports are up to 0.5 Bcf/d, from being negligible in 2012.
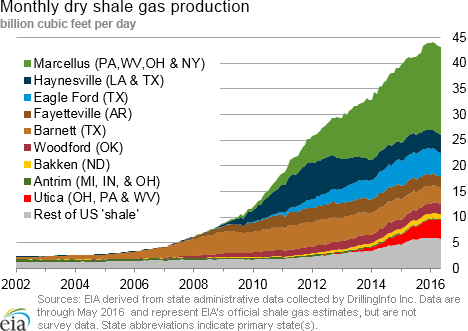
Supply of natural gas remains strong, despite slowing production. During the refill season, natural gas production has averaged 73 Bcf/d, about 1% below last year during the same period, but 14% above the same period in 2012. However, the June U.S. Energy Administration (EIA) Drilling Productivity Report indicates that production has slowed in all seven of the shale producing regions. Nevertheless, natural gas prices have risen in recent weeks, and sustained increases in prices could lead to increased drilling, well completions, and natural gas production.
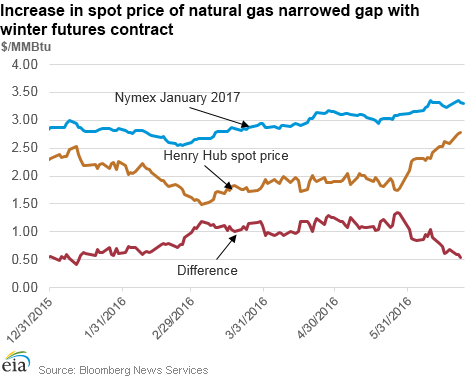
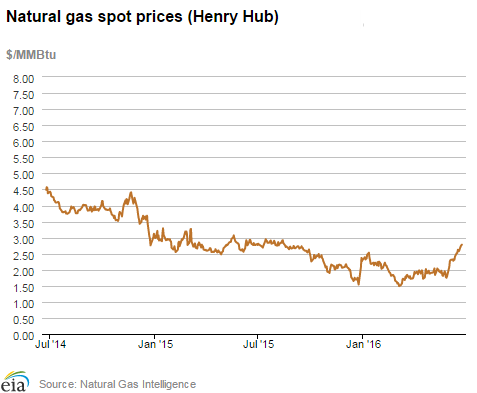
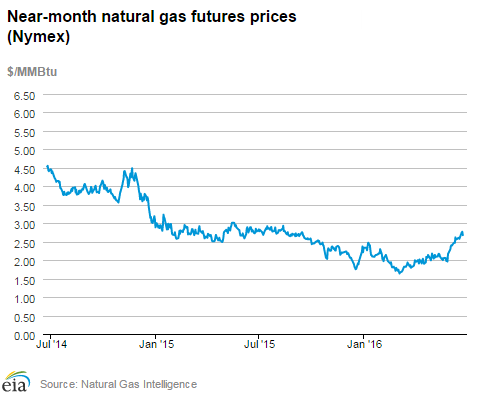
Natural gas spot prices rise faster than futures contracts prices next winter. Natural gas spot prices at the Henry Hub have risen from $1.79 per million British thermal unit (MMBtu) on May 27, 2016, to $2.78/MMBtu as of June 22. Concurrently, the New York Mercantile Exchange (Nymex) futures contract for January 2017 delivery at the Henry Hub increased from $3.10/MMBtu to $3.35/MMBtu. Although the premium of the January contract over the spot price has narrowed considerably to 59¢/MMBtu from $1.31/MMBtu on May 27, incentive to inject natural gas into storage remains high. Moreover, the higher price levels will improve the economics for increasing production, particularly if they climb further above $2.75/MMBtu for a sustained period.
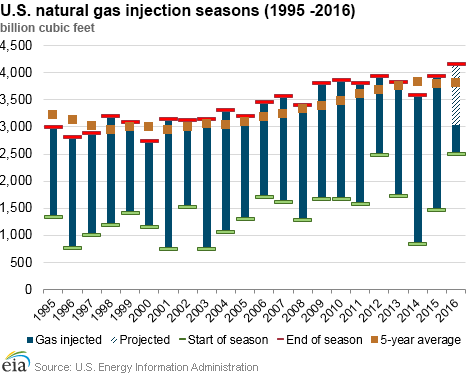
So far, injections into working gas are about 15% ahead of the pace set in 2012 because of the growth in natural gas supply compared with demand since then. The EIA Short-Term Energy Outlook forecasts that working gas stocks will continue to follow the path set in 2012, reaching a record 4,161 Bcf by the end of the refill season. This would be 96% of total demonstrated storage capacity.
Overview:
(For the Week Ending Wednesday, June 22, 2016)
- Natural gas spot prices rose across the country this report week (Wednesday, June 15, to Wednesday, June 22). The Henry Hub spot price continued its recent increases, rising by 16¢ from $2.62/MMBtu last Wednesday to $2.78/MMBtu yesterday.
- At the Nymex, the July 2016 contract continued to rise, increasing from $2.595/MMBtu last Wednesday to $2.677/MMBtu yesterday.
- Net injections of working gas totaled 62 Bcf for the week ending June 17. Working gas stocks are 3,103 Bcf, which is 25% above the year-ago level and 28% above the five-year (2011-15) average for this week.
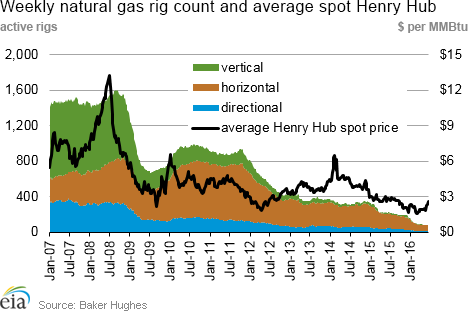
- According to Baker Hughes, for the week ending Friday, June 17, the natural gas rig count increased by 1 to 86. Oil-directed rigs increased by 9 to 337. This is the third consecutive weekly increase in the oil rig count. The total rig count increased by 10 over the week.
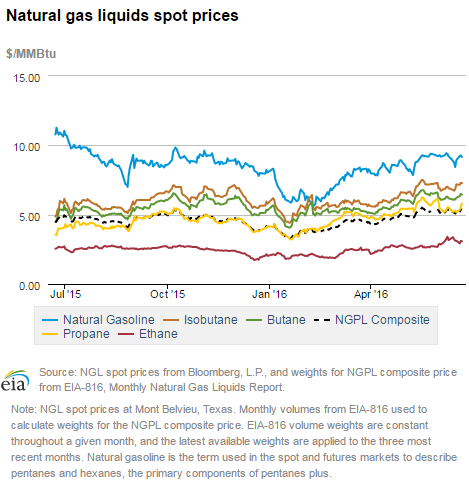
- The natural gas plant liquids composite price at Mont Belvieu, Texas, fell by 10¢, closing at $5.16/MMBtu for the week ending June 17. The price of ethane rose 1%, but the prices of all of the other composite fuels fell. Butane and isobutane prices fell by 1% each, propane fell by 2%, and natural gasoline fell by 6%.
Prices/Supply/Demand:
Spot prices rise nationwide. The Henry Hub spot price continued its upward trajectory this week, rising by 16¢, from $2.62/MMBtu last Wednesday to $2.78/MMBtu yesterday. After four consecutive weeks of increases, the Henry Hub spot price is at its highest level since August 2015. Prices around the country saw similar increases. At the Chicago Citygate, prices increased by 20¢ from the previous report week and closed at $2.73/MMBtu yesterday.
California heat wave leads to price increases. On the West Coast, prices rose substantially as temperatures reached well into the 90s this week. The PG&E Citygate price in California rose by 50¢ over the report week, from $2.52/MMBtu to $3.02/MMBtu yesterday. Similarly, at the SoCal Citygate, prices rose 46¢, to $2.99/MMBtu.
Northeast prices post gains this week. Prices in major northeastern market areas also rose during the report period. At the Algonquin Citygate, which serves Boston-area consumers, prices rose 65¢ from $2.15/MMBtu to $2.80/MMBtu, Wednesday to Wednesday. At the Transcontinental Pipeline's Zone 6 trading point for New York, prices rose 16¢, from $1.85 last Wednesday to $2.01/MMBtu yesterday.
Marcellus prices continue to increase. Marcellus-area prices also increased over the week. The Tennessee Zone 4 Marcellus price rose 24¢ from $1.61/MMBtu last Wednesday to $1.85 /MMBtu yesterday. The price at Dominion South in northwest Pennsylvania rose by 19¢, ending the week at $1.91/MMBtu. Marcellus prices still trade at a discount to the major Northeast market areas of New York and Boston, as well as to the Henry Hub price, but the differential has narrowed in recent months.
Nymex prices increase. At the Nymex, the July 2016 contract rose from $2.595 /MMBtu last Wednesday to $2.677/MMBtu yesterday, an increase of about 8¢. The 12-month strip, which averages the July 2016 through June 2017 futures contracts, also increased 6¢, to $2.980/MMBtu. Before settling Wednesday, the 12-month strip on Monday and Tuesday averaged more than $3/MMBtu for the first time since August 2015.
Production flat. According to data from PointLogic, average total supply rose by 1% this report week. Production was flat week over week, and is equal to its year-ago level. Net imports from Canada rose 2% from last week.
Consumption rises. Average consumption for the report week rose 3% according to data from PointLogic. This increase was driven by a 7% increase in consumption of natural gas for electric power generation. Power burn this week was 6% greater than year-ago levels. In the residential/commercial sector, consumption fell by 11%. Industrial consumption and exports to Mexico rose by 1% and 2%, respectively.
U.S. LNG exports. The natural gas pipeline flows to the Sabine Pass liquefaction terminal averaged 0.61 Bcf/d, 1% higher than receipts last week. One vessel (LNG-carrying capacity 3.2 Bcf) departed Sabine Pass terminal on June 20 and one vessel (LNG-carrying capacity 3.7 Bcf) is currently loading at the terminal.
Storage:
Working gas fill continues at slower-than-normal pace. Net injections into storage totaled 62 Bcf during the storage report week, compared with the five-year (2011-15) average of 88 Bcf and last year's net injection of 77 Bcf during the same week. As a result, the surplus in storage compared with the five-year average declined from the previous week to 678 Bcf, and the surplus compared with year-ago levels decreased to 618 Bcf. The year-over-year storage surplus fell for the eleventh consecutive week.
The January futures price premium over the current spot price remains below $1. During the most recent storage week, the average natural gas spot price at the Henry Hub was $2.54/MMBtu, while the Nymex futures price of natural gas for delivery in January 2017 averaged $3.27/MMBtu, a difference of 74¢/MMBtu. This marks the second week in a row that the January futures contract premium over the spot price was less than $1. A year ago, the premium was 45¢/MMBtu. The average Henry Hub price so far in the injection season this year, from April 1 to June 17, was $2.02/MMBtu, 26% lower than the average value of $2.72/MMBtu for the same period last year.
Stock change is within the range of analyst expectations. Expected net injections for the week ranged from 47 to 66 Bcf, with a median of 60 Bcf. Prices for the Nymex futures contract for July delivery at the Henry Hub fell about 4¢/MMBtu to $2.64/MMBtu, with 197 contracts traded at the release. Prices rebounded somewhat in subsequent trading, reaching $2.66/MMBtu within two minutes of EIA's Weekly Natural Gas Storage Report release.
Rising temperatures boost cooling demand for natural gas. Temperatures in the Lower 48 states averaged 72°F during the storage report week, climbing 2% from the previous week. Temperatures during the report week were 3% above normal and 3% below last year at this time. Temperatures were above normal in most of the Lower 48 states, excluding the New England, Middle Atlantic, and Pacific U.S. Census divisions.
See also:
| Spot Prices ($/MMBtu) | Thu, 16-Jun |
Fri, 17-Jun |
Mon, 20-Jun |
Tue, 21-Jun |
Wed, 22-Jun |
|---|---|---|---|---|---|
| Henry Hub |
2.61 |
2.58 |
2.73 |
2.76 |
2.78 |
| New York |
1.78 |
1.72 |
2.19 |
2.25 |
2.01 |
| Chicago |
2.50 |
2.54 |
2.67 |
2.74 |
2.73 |
| Cal. Comp. Avg.* |
2.44 |
2.72 |
2.86 |
2.87 |
2.84 |
| Futures ($/MMBtu) | |||||
| July contract |
2.580 |
2.623 |
2.747 |
2.768 |
2.677 |
| August contract |
2.627 |
2.666 |
2.777 |
2.798 |
2.711 |
| *Avg. of NGI's reported prices for: Malin, PG&E Citygate, and Southern California Border Avg. | |||||
| Source: NGI's Daily Gas Price Index | |||||
| U.S. natural gas supply - Gas week: (6/16/16 - 6/22/16) | |||
|---|---|---|---|
Average daily values (Bcf/d): |
|||
this week |
last week |
last year |
|
| Marketed production | 80.7 |
80.3 |
80.6 |
| Dry production | 73.0 |
72.7 |
72.7 |
| Net Canada imports | 6.9 |
6.8 |
5.9 |
| LNG pipeline deliveries | 0.2 |
0.2 |
0.2 |
| Total supply | 80.2 |
79.7 |
78.8 |
|
Source: OPIS PointLogic Energy, an IHS Company | |||
| U.S. natural gas consumption - Gas week: (6/16/16 - 6/22/16) | |||
|---|---|---|---|
Average daily values (Bcf/d): |
|||
this week |
last week |
last year |
|
| U.S. consumption | 61.0 |
59.4 |
61.0 |
| Power | 33.9 |
31.6 |
32.0 |
| Industrial | 19.6 |
19.5 |
19.4 |
| Residential/commercial | 7.5 |
8.4 |
9.6 |
| Mexico exports | 3.7 |
3.6 |
3.0 |
| Pipeloss fuel use/losses | 6.8 |
6.6 |
6.8 |
| LNG pipeline receipts | 0.6 |
0.6 |
- |
| Total demand | 72.0 |
70.2 |
70.8 |
|
Source: OPIS PointLogic Energy, an IHS Company | |||

| Rigs | |||
|---|---|---|---|
Fri, June 17, 2016 |
Change from |
||
last week |
last year |
||
| Oil rigs | 337 |
2.7% |
-46.6% |
| Natural gas rigs | 86 |
1.2% |
-61.4% |
| Miscellaneous | 1 |
0.0% |
-66.7% |
| Rig numbers by type | |||
|---|---|---|---|
Fri, June 17, 2016 |
Change from |
||
last week |
last year |
||
| Vertical | 53 |
15.2% |
-47.0% |
| Horizontal | 326 |
0.9% |
-50.8% |
| Directional | 45 |
0.0% |
-52.6% |
| Source: Baker Hughes Inc. | |||
| Working gas in underground storage | ||||
|---|---|---|---|---|
Stocks billion cubic feet (bcf) |
||||
| Region | 2016-06-17 |
2016-06-10 |
change |
|
| East | 612 |
585 |
27 |
|
| Midwest | 724 |
703 |
21 |
|
| Mountain | 194 |
188 |
6 |
|
| Pacific | 318 |
312 |
6 |
|
| South Central | 1,255 |
1,253 |
2 |
|
| Total | 3,103 |
3,041 |
62 |
|
| Source: U.S. Energy Information Administration | ||||
| Working gas in underground storage | |||||
|---|---|---|---|---|---|
Historical comparisons |
|||||
Year ago (6/17/15) |
5-year average (2011-2015) |
||||
| Region | Stocks (Bcf) |
% change |
Stocks (Bcf) |
% change |
|
| East | 517 |
18.4 |
545 |
12.3 |
|
| Midwest | 510 |
42.0 |
547 |
32.4 |
|
| Mountain | 149 |
30.2 |
139 |
39.6 |
|
| Pacific | 331 |
-3.9 |
289 |
10.0 |
|
| South Central | 978 |
28.3 |
904 |
38.8 |
|
| Total | 2,485 |
24.9 |
2,425 |
28.0 |
|
| Source: U.S. Energy Information Administration | |||||
| Temperature -- heating & cooling degree days (week ending Jun 16) | ||||||||
|---|---|---|---|---|---|---|---|---|
HDD deviation from: |
CDD deviation from: |
|||||||
| Region | HDD Current |
normal |
last year |
CDD Current |
normal |
last year |
||
| New England | 21
|
6
|
12
|
8
|
-3
|
-19
|
||
| Middle Atlantic | 8
|
-1
|
8
|
15
|
-9
|
-42
|
||
| E N Central | 4
|
-9
|
-1
|
53
|
21
|
5
|
||
| W N Central | 1
|
-11
|
-8
|
84
|
42
|
38
|
||
| South Atlantic | 0
|
-2
|
0
|
94
|
22
|
-17
|
||
| E S Central | 0
|
-1
|
0
|
97
|
30
|
-5
|
||
| W S Central | 0
|
0
|
0
|
123
|
24
|
16
|
||
| Mountain | 8
|
-16
|
0
|
52
|
1
|
-12
|
||
| Pacific | 15
|
-1
|
13
|
2
|
-19
|
-39
|
||
| United States | 6
|
-5
|
3
|
58
|
11
|
-12
|
||
|
Note: HDD = heating degree-day; CDD = cooling degree-day Source: National Oceanic and Atmospheric Administration | ||||||||
Average temperature (°F)
7-Day Mean ending Jun 16, 2016
Source: NOAA/National Weather Service
Deviation between average and normal (°F)
7-Day Mean ending Jun 16, 2016
Source: NOAA/National Weather Service