Forecast overview
- Trade policy assumptions. The U.S. macroeconomic outlook we use in the Short-Term Energy Outlook (STEO) is based on S&P Global’s macroeconomic model. S&P Global’s most recent model reflects the tariffs announced on April 2, but the model was finalized prior to the 90-day temporary suspension of tariffs granted to certain countries. As a result, our macroeconomic forecast assumes significantly lower tariffs on China’s products than are currently in place and significantly higher tariffs on countries subject to the 90-day temporary suspension. These differences in tariff rates likely have offsetting effects on the macroeconomic forecast.
- Macroeconomics. Our U.S. GDP forecast has been revised downwards from our April STEO. We now assume real GDP will grow by 1.5% in 2025, a 0.5 percentage point reduction from the April STEO, and 1.6% in 2026, a 0.4 percentage point reduction from last month.
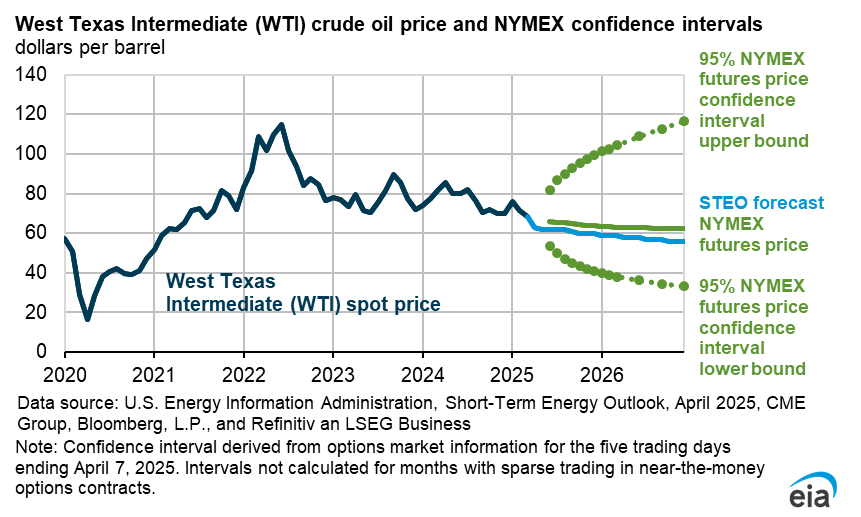
- Global oil prices. We expect crude oil prices to fall over much of the forecast period. The Brent crude oil spot price averaged $68 per barrel (b) in April. In our forecast, increasing oil production outpaces annual oil demand growth, which rises by around 1.0 million barrels per day (b/d) in both 2025 and 2026, leading to the accumulation of oil inventories globally. We expect the rising inventories will result in the Brent price averaging $62/b in the second half of this year and falling to $59/b next year.
- Global oil production. We forecast global liquid fuels production will increase by between 1.3 b/d and 1.4 million b/d in both 2025 and 2026 led by production growth in countries outside of OPEC+. We completed modeling and analysis for this forecast before OPEC+ announced on May 3 that it would raise production in June. Although we expect OPEC+ to increase production somewhat in the coming months, we expect OPEC+ production to remain below the current target path.
- U.S. ethane markets. In late April, China waived a retaliatory 125% tariff on imports of U.S. ethane that had been levied earlier in the month. With that tariff no longer in place, we continue to expect strong growth in U.S. ethane production and exports in our forecast. We forecast the United States will produce 2.9 million b/d of ethane this year and 3.1 million b/d next year, up from 2.8 million b/d in 2024. Most of this growth in ethane production will be exported to supply growing international demand.
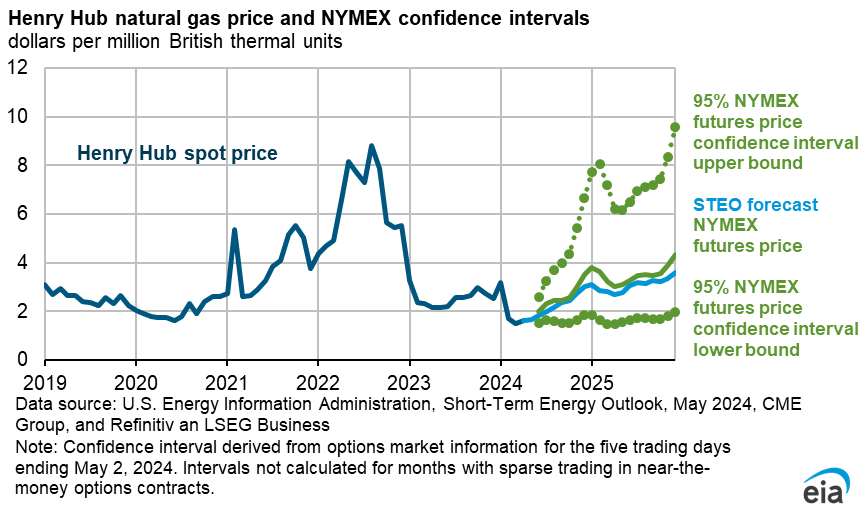
- Natural gas prices. The Henry Hub spot price fell to $3.44 per million British thermal units (MMBtu) in April, down 68 cents/MMBtu from the March average. The price decrease was primarily driven by relatively warm weather in March and early April, which led to higher-than-expected levels of natural gas injections into storage. We expect natural gas prices will rise in the coming months as the United States exports more LNG and demand for natural gas from the electric power sector increases seasonally. We forecast the Henry Hub spot price will average nearly $4.20/MMBtu in the third quarter of 2025 (3Q25). Despite rising seasonal demand for natural gas heading into summer, our forecast for the 3Q25 Henry Hub price is almost double the price from a year earlier and is contributing to our expectation of less natural gas use in the electric power sector on average this year compared with last year.
- Electricity generation. Although we expect the U.S. power sector will generate 2% more electricity this year than it did in 2024, we forecast generation from U.S. natural gas-fired power plants will decline by 3% in 2025, partially driven by rising natural gas prices. Less generation from natural gas contributes to a 6% increase in generation from coal. U.S. solar generation continues to provide the largest increases in electricity generation in our forecast, increasing by 34% in 2025 and 18% in 2026.
- Coal markets. With U.S. coal-fired power plants generating more electricity this year, we now expect coal production will decline by less than we previously expected. We forecast U.S. coal production will total 506 million short tons in 2025, nearly the same amount of coal that was produced last year. Last month, we expected U.S. coal production to fall by 4% this year compared with last year.
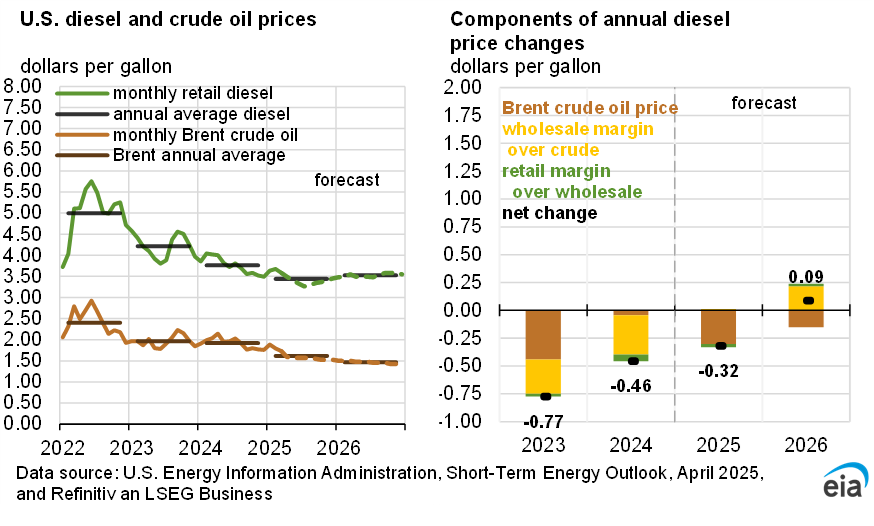
- Summer fuels. This month we published our Gasoline Summer Outlook table and our Electricity Summer Outlook table. We expect gasoline prices across the United States will average $3.14 per gallon over 2Q25 and 3Q25, down 9% from the same period last year. Lower gasoline prices this summer mostly reflect lower crude oil prices. For electricity, we expect the average U.S. electricity bill will be about 4% more this summer (June, July, and August) compared with last summer. The increase is the result of electricity prices that we expect will be 4% higher this summer, largely reflecting an increase in natural gas prices.
| Notable Forecast Changes | 2025 | 2026 |
|---|---|---|
Note: Values in this table are rounded and may not match values in other tables in this report. Percentages are calculated from unrounded values. |
||
| Global oil inventory change (million barrels per day) | 0.4 | 0.8 |
| Previous forecast | 0.5 | 0.7 |
| Change | -0.1 | 0.1 |
| U.S. secondary coal inventories (million short tons) | 121 | 116 |
| Previous forecast | 108 | 100 |
| Percentage change | 11.6% | 16.5% |
| U.S coal production (million short tons) | 506 | 475 |
| Previous forecast | 489 | 466 |
| Percentage change | 3.5% | 1.9% |
| World GDP (percentage change) | 2.8 | 2.8 |
| Previous forecast | 3.1 | 3.2 |
| Percentage point change | -0.3 | -0.4 |
| U.S. GDP (percentage change) | 1.5 | 1.6 |
| Previous forecast | 2.0 | 2.0 |
| Percentage point change | -0.5 | -0.4 |
You can find more information in the detailed table of forecast changes.