Wind power plants require careful planning
Operating a wind power plant is more complex than simply erecting wind turbines in a windy area. Wind power plant owners must carefully plan where to position wind turbines and must consider how fast and how often the wind blows at the site.
Good places for wind turbines are where the annual average wind speed is at least 9 miles per hour (mph)—or 4.0 meters per second (m/s)—for small wind turbines and 13 mph (5.8 m/s) for utility-scale turbines. Favorable sites include the tops of smooth, rounded hills; open plains and water; and mountain gaps that funnel and intensify wind. Wind speeds are generally higher the greater the distance above the earth’s surface. Large wind turbines are placed on towers that range from about 500 feet to as high as 900 feet tall.
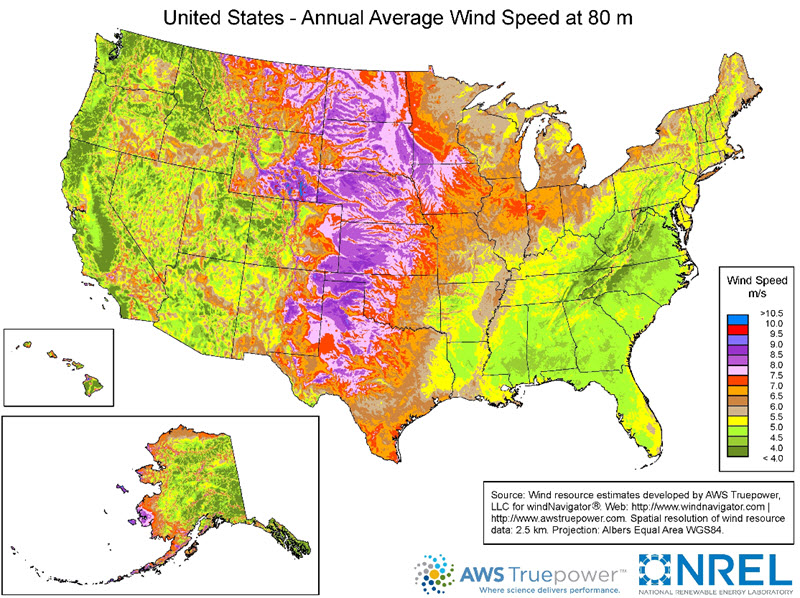
Map of U.S. wind resources
Source: National Renewable Energy Laboratory, U.S. Department of Energy (public domain)
Wind speeds vary hourly and seasonally
Wind energy resources vary hourly and seasonally throughout the United States. Wind speeds generally change throughout the day and from season to season. For example, in Tehachapi, California, where numerous wind turbines are located, the wind blows more frequently from April through October than it does in the winter, and the wind is usually strongest in the afternoon. These fluctuations are a result of the extreme heat of the Mojave Desert during summer months. As the hot air over the desert rises, the cooler, denser air above the Pacific Ocean rushes through the Tehachapi mountain pass to take its place. In Montana, strong winter winds channeled through Rocky Mountain valleys create more intense winds during the winter.
Fortunately, the seasonal variations in wind speeds in California and Montana match the electricity demands of consumers in those states. In California, people use more electricity in the afternoon and during the summer. In Montana, people use more electricity, in general, during the winter.
Most U.S. wind electricity generation capacity is in the middle of the country
In 2022, 42 states had utility-scale1 wind power projects, which together produced about 10% (435 billion kilowatthours [kWh]) of total U.S. utility-scale electricity generation. The five states with the most electricity generation from wind in 2022 were Texas, Iowa, Oklahoma, Kansas, and Illinois. These states combined produced about 57% of total U.S. wind electricity generation in 2022.2
Monthly and annual U.S. national and state electricity generation data are available in the Electricity Data Browser, and hourly generation data by energy source for the Lower 48 states by region are available in the Hourly Electric Grid Monitor.
U.S. offshore wind energy is expected to increase substantially
The waters off the coasts of the United States have significant potential for electricity generation from wind energy. The United States has two operating offshore wind energy projects: the Block Island wind farm off the coast of Rhode Island, with 30 megawatts (MW) of electricity generation capacity, and the Coastal Virginia Offshore Wind pilot project, with 12 MW of generation capacity. The U.S. Bureau of Ocean Energy Management has executed leases and grants for offshore wind energy development. Wind projects in state and federal waters off the U.S. East Coast are in various stages of planning and development. As of December 2022, wind project developers reported plans for about 7,500 MW of nameplate wind electricity generation capacity in waters off the coasts of Maryland, Massachusetts, New Jersey, Rhode Island, and Virginia and about 20 MW in Ohio state waters on Lake Erie.3
European countries and China lead the world in offshore wind electricity generation capacity. Many other countries have and are developing offshore wind energy projects.
Wind turbines in the ocean
Source: Stock photography (copyrighted)
International wind power is growing
World wind electricity generation has also increased substantially in recent years. In 1990, 16 countries generated about 3.6 billion kWh of wind electricity.4 In 2010, 100 countries generated about 339 billion kWh, and in 2021, 128 countries (includes Puerto Rico) generated about 1,808 billion kWh of wind electricity.
The top five countries in wind electricity generation and their percentage shares of total world wind electricity generation in 2021 were:
- China–34%
- United States–21%
- Germany–6%
- India–4%
- Brazil–4%
1 Utility-scale facilities (power plants) have at least one megawatt (1,000 kilowatts) of electric generation capacity.
2 Source: U.S. Energy Information Administration, Electric Power Monthly, February 2023, preliminary data.
3 Source: U.S. Energy Information Administration, Preliminary Monthly Electric Generator Inventory, December 2022.
4 Source: U.S. Energy Information Administration, International energy statistics, Wind electricity generation.
Last updated: April 20, 2023, with data available at the time of update.