Annual Energy Review
September 2012 PDF | previous editions
Release Date: September 27, 2012
Total Energy Flow, (Quadrillion Btu)
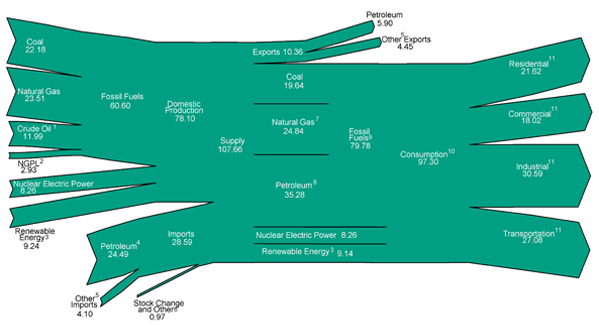
Footnotes:
1 Includes lease condensate.
2 Natural gas plant liquids.
3 Conventional hydroelectric power, biomass, geothermal, solar/photovoltaic, and wind.
4 Crude oil and petroleum products. Includes imports into the Strategic Petroleum Reserve.
5 Natural gas, coal, coal coke, biofuels, and electricity.
6 Adjustments, losses, and unaccounted for.
7 Natural gas only; excludes supplemental gaseous fuels.
8 Petroleum products, including natural gas plant liquids, and crude oil burned as fuel.
9 Includes 0.01 quadrillion Btu of coal coke net exports.
10 Includes 0.13 quadrillion Btu of electricity net imports.
11 Total energy consumption, which is the sum of primary energy consumption,
electricity retail sales, and electrical system energy losses. Losses are allocated to the
end-use sectors in proportion to each sector's share of total electricity retail sales. See
Note, "Electrical Systems Energy Losses," at end of Section 2.
Notes:
• Data are preliminary.
• Values are derived from source data prior to rounding for publication.
• Totals may not equal sum of components due to independent rounding.
Sources:
U.S. Energy Information Administration, Annual Energy Review 2011 Tables 1.1, 1.2, 1.3, 1.4, and 2.1a.