Major gasoline pipeline in Southeast disrupted for second time in two months
Note: Click to enlarge.
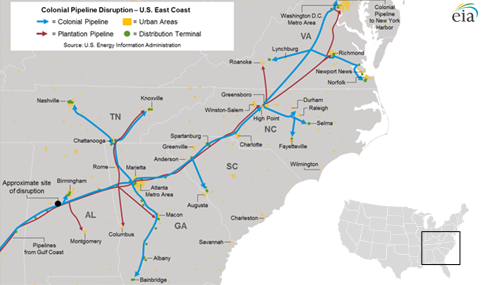
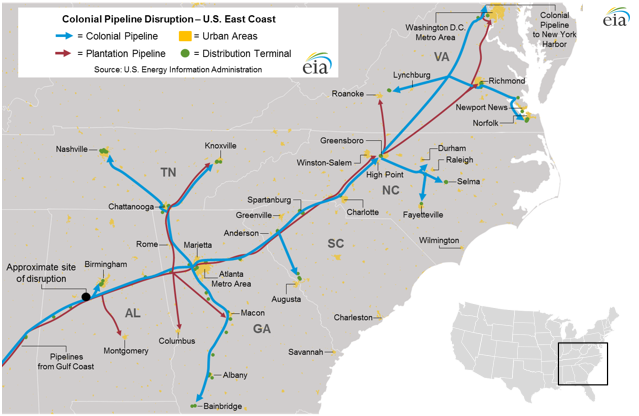
On the afternoon of October 31, an explosion occurred on the Colonial Pipeline Line 1, which carries gasoline from the Gulf Coast to as far east and north as North Carolina and is a key supply source for several states in between and beyond. This is the second major disruption of Colonial Line 1 in less than two months.
Because there are no petroleum refineries between Alabama and Pennsylvania that produce substantial quantities of transportation fuels, the U.S. Southeast is supplied primarily by pipeline flows from refineries along the U.S. Gulf Coast and supplemented by marine shipments from the U.S. Gulf Coast and imports from other countries. The Colonial pipeline system is the largest petroleum product pipeline system in the country.
Colonial's Line 1 carries 1.4 million barrels per day of gasoline from the U.S. Gulf Coast to a major junction and product storage hub in Greensboro, North Carolina. Various branches provide gasoline to central and eastern Tennessee, southern Georgia, and eastern and western portions of Virginia. Beyond Greensboro, other portions of Colonial's system send gasoline and other transportation fuels to Maryland and Linden, New Jersey, near New York Harbor.
In the prior incident, Colonial Pipeline shut down Line 1 on September 9 in response to a leak in Shelby County, Alabama, about 35 miles south of Birmingham. Workers constructed a 500-foot, above-ground bypass to restore operations on Line 1 by September 21.
On October 31, a crew working on Line 1 several miles from the site of the September leak hit the pipeline with a trackhoe, which caused a fire. Based on statements issued by Colonial, Line 1 is currently shut down. Line 2, which runs parallel to Line 1 and usually carries diesel, jet fuel, and other distillates, was restarted around 11:00 p.m. Central Time on October 31.
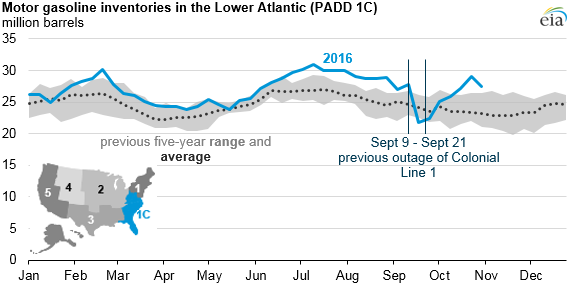
Following the September 9–21 shutdown of Colonial Line 1, gasoline inventories in the Southeast were heavily drawn. During the week ending September 16, total motor gasoline stocks in the Lower Atlantic (PADD 1C) fell by nearly 6 million barrels, reaching 22 million barrels. This drop was the largest reduction in weekly PADD 1C region gasoline inventories on record.
During the week ending September 23, gasoline inventories grew slightly as affected markets sought alternative supply arrangements. Colonial Pipeline temporarily shipped gasoline on its Line 2 pipeline, which was not disrupted. Other gasoline supplies were trucked into the region or arrived by marine imports, some of which could have been diverted from other markets while still in transit.
Following the return to service of Line 1 on September 21, and as increased imports continued to supply the region, gasoline inventories in PADD 1C began to build back up to previous levels over the course of the next several weeks. Inventories reached 27.5 million barrels, or nearly 20% above the previous five-year average, as of the week ending October 28.
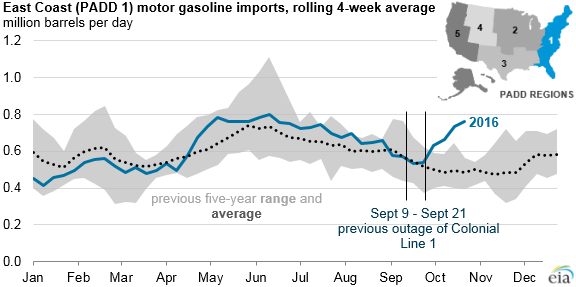
The supply chain response to the current disruption is likely to follow the response to the previous incident, with a drawdown of in-region inventories and increased reliance on alternative sources of supply such as long-distance trucking, marine shipments from the U.S. Gulf Coast, and imports. Retail gasoline prices in the affected areas are likely to increase as these alternative supply options are more costly than the pipeline transportation provided by Colonial.
Principal contributors: Mason Hamilton, Hannah Breul
Tags: distribution, gasoline, liquid fuels, map, oil/petroleum, pipelines, transportation