
Hydraulic fracturing accounts for about half of current U.S. crude oil production
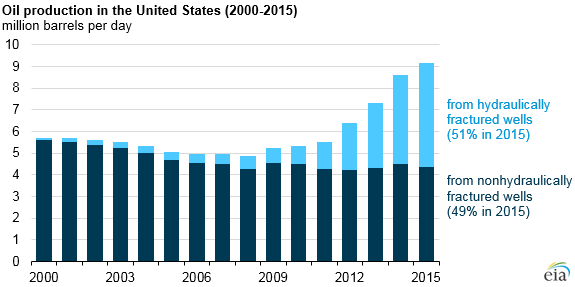
Even though hydraulic fracturing has been in use for more than six decades, it has only recently been used to produce a significant portion of crude oil in the United States. This technique, often used in combination with horizontal drilling, has allowed the United States to increase its oil production faster than at any time in its history. Based on the most recent available data from states, EIA estimates that oil production from hydraulically fractured wells now makes up about half of total U.S. crude oil production.
Hydraulic fracturing involves forcing a liquid (primarily water) under high pressure from a wellbore against a rock formation until it fractures. The fracture lengthens as the high-pressure liquid in the wellbore flows into the formation. This injected liquid contains a proppant, or small, solid particles (usually sand or a manmade granular solid of similar size) that fills the expanding fracture. When the injection is stopped and the high pressure is reduced, the formation attempts to settle back into its original configuration, but the proppant keeps the fracture open. This allows hydrocarbons such as crude oil and natural gas to flow from the rock formation back to the wellbore and then to the surface.
Using well completion and production data from DrillingInfo and IHS Global Insight, EIA created a profile of oil production in the United States. In 2000, approximately 23,000 hydraulically fractured wells produced 102,000 barrels per day (b/d) of oil in the United States, making up less than 2% of the national total. By 2015, the number of hydraulically fractured wells grew to an estimated 300,000, and production from those wells had grown to more than 4.3 million b/d, making up about 50% of the total oil output of the United States. These results may vary from other sources because of the types of wells included in the analysis and update schedules of source databases.
This new oil production has primarily come from shale and other tight rocks in the Eagle Ford formation and Permian Basin of Texas, and the Bakken and Three Forks formation of Montana and North Dakota.
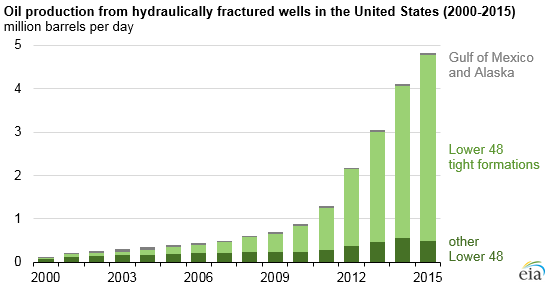
The use of hydraulic fracturing is not limited to certain oil-containing formations such as shales or source rocks, nor is its use limited to only horizontal wells. Hydraulic fracturing has been successfully used in directional and vertical wells, both natural gas and oil wells, in tight formations and reservoirs, and in offshore crude oil production.
More information on U.S. crude oil production from tight formations is available in EIA's most recent Drilling Productivity Report.
Principal contributors: Troy Cook, Jack Perrin
Tags: crude oil, drilling, production/supply