Average annual natural gas spot price in 2015 was at lowest level since 1999
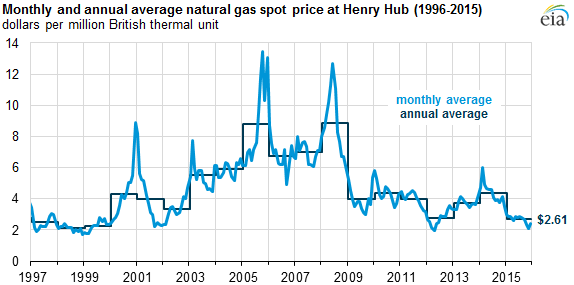
Natural gas spot prices in 2015 at the Henry Hub in Louisiana, a national benchmark, averaged $2.61 per million British thermal unit (MMBtu), the lowest annual average level since 1999. Daily prices fell below $2/MMBtu this year for the first time since 2012. Henry Hub spot prices began the year relatively low and fell throughout 2015, as production and storage inventories hit record levels and fourth-quarter temperatures were much warmer than normal.
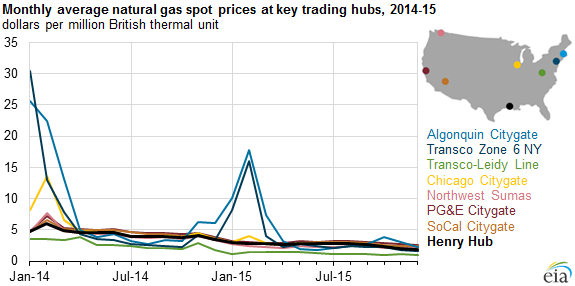
Natural gas prices at key regional trading hubs ended the year lower than their starting point. At northeastern locations, where natural gas transmission infrastructure is often constrained, prices spiked in the early months of 2015, which were colder than normal compared to much of the United States. Prices at the Algonquin Citygate, which serves Boston, and at Transcontinental Pipeline's Zone 6, which serves New York City, began the year much higher than the Henry Hub spot prices in early 2015, but then fell below the national benchmark for much of the rest of the year. The annual average spot price at Henry Hub of $2.61/MMBtu was $1.78/MMBtu, or 41%, lower than the 2014 average.
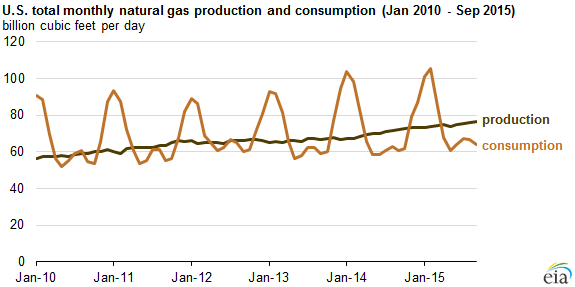
Despite declining prices, total natural gas production, measured in terms of dry gas volume, averaged an estimated 74.9 billion cubic feet per day (Bcf/d) in 2015, 6.3% greater than in 2014. This increase occurred even as the number of natural gas-directed drilling rigs decreased. As of December 18, there were 168 natural gas-directed rigs in operation, only about half the number of rigs at the beginning of 2015, according to data from Baker Hughes Inc. However, the remaining rigs are among the most productive, and producers have continued to make gains in drilling efficiency.
Low prices and strong production led to increase use of natural gas for electric power generation, which is projected to be about 26.5 Bcf/d in 2015, exceeding the 24.9 Bcf/d level in 2012. Natural gas surpassed coal as the leading source of electricity generation on a monthly basis for the first time in April, and again in each of the four months from July through October.
In the residential and commercial sectors, which use natural gas primarily for heating, consumption in 2015 declined 6.7% and 4.4%, respectively, from the previous year largely because of warmer weather. Natural gas consumption in the residential and commercial sectors was particularly high in 2014 because of cold temperatures in the first and fourth quarters. Although 2015 had a cold start, temperatures in the fourth quarter were warmer than normal throughout most of the United States.
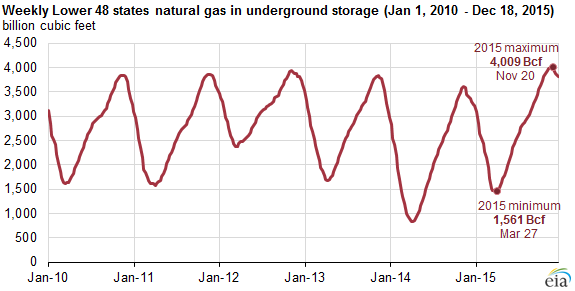
Growth in production also allowed for strong builds in working natural gas inventory. Inventories surpassed 4,000 Bcf for the first time, reaching 4,009 Bcf in the week ending November 20.
With much of the growth in natural gas production in the Marcellus and Utica shale regions in the Midwest, several major pipeline projects came online in 2015 to transport natural gas from these plays to consumers. In August 2015, the Rockies Express Pipeline (REX) reversal was completed. REX, one of the longest natural gas pipelines in the United States, began service in 2009 to bring Rockies gas eastward. As Marcellus production increased, however, demand in the East for natural gas produced in the Rockies declined. The REX reversal added westbound capacity to enable the transport of natural gas produced in the Marcellus and Utica Shale regions to consuming markets in the Midwest. Several other new pipeline projects began to take natural gas produced in the Marcellus and Utica regions to consumer areas on the East Coast, Midwest, and Gulf Coast area.
Principal contributor: Katie Teller