2012 Brief: U.S. ethanol prices and production lower compared to 2011
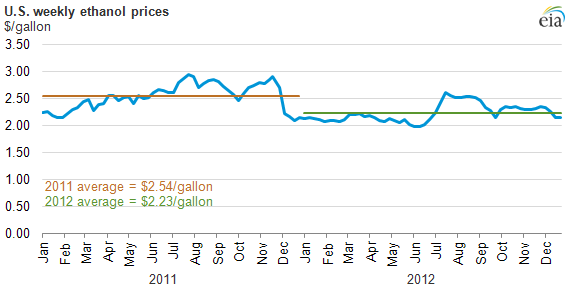
Spot prices for U.S. fuel ethanol were lower throughout most of 2012 compared to 2011. Prices were relatively stable during the first half of 2012, but they rose at mid-year as severe drought and scorching temperatures reduced corn yields, resulting in higher prices for corn that is used to make nearly all U.S. ethanol.
Ethanol spot prices rose from a low of around $2 per gallon in mid-June to a 2012 peak of $2.61 in late July. However, that was still 30 cents per gallon lower than the peak spot price at about the same time in 2011. Ethanol prices last year did not rise above 2011 levels until December 2012.
Higher ethanol prices during the second half of 2012 were mainly the result of higher corn prices, which rose 35% from mid-June through August because of concerns that the corn crop would be affected by the worst drought in the Midwest since the 1950s, coupled with triple-digit temperatures. During the hot and dry summer of 2012, the U.S. Department of Agriculture reported that 88% of the U.S. corn crop was within a drought area. The 2012-13 U.S. corn crop is expected to be the smallest in six years at nearly 10.8 billion bushels, according to USDA's January 2013 crop forecast, 13% smaller than the 2011-12 crop. USDA indicates that about 4.5 billion bushels, or 42% of the harvest, will go to make ethanol. That level is down from just over 5 billion bushels used to make ethanol during the previous crop year.
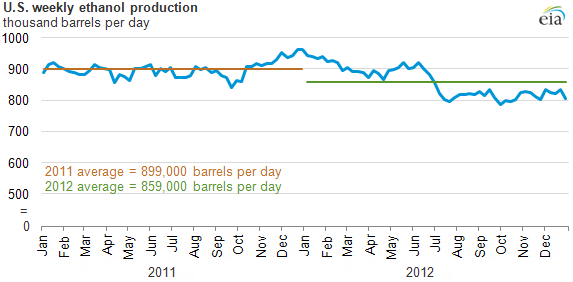
The combination of lower corn supplies, higher corn prices for ethanol producers, and weaker gasoline demand contributed to U.S. ethanol output falling from an average 900,000 barrels per day (bbl/day) during the first half of 2012 to an average of 815,000 bbl/day during in latter half, about 90,000 bbl/day less than in the second half of 2011, according to EIA data.
Ethanol production capacity was little changed in 2012. There were 194 ethanol plants in the United States at the beginning of 2012, with a maximum sustainable production capacity of 934,000 bbl/day, according to EIA. That level is slightly higher than 193 plants a year earlier, with a sustainable capacity of 929,000 bbl/day of ethanol.
Partly because of lower domestic ethanol production during the second half of 2012, the United States became a net importer of ethanol in August 2012 for the first time since January 2010. The United States continued to import more ethanol, mostly sugar cane-based ethanol from Brazil, than it exported through October 2012, according to the latest available data.
Most gasoline sold in the United States contains 10% ethanol by volume. However, gasoline that is 15% ethanol, which the Environmental Protection Agency approved as E15 in 2011 for use in vehicles built since the 2001 model year, began selling last summer. Use of E15 was extremely small during 2012, as only eight fueling stations in Kansas, Nebraska, and Iowa were selling the motor fuel by the end of the year.
For more information on the U.S. ethanol market during 2012 read EIA's Biofuels Issues and Trends report.