
Drought increases price of corn, reduces profits to ethanol producers
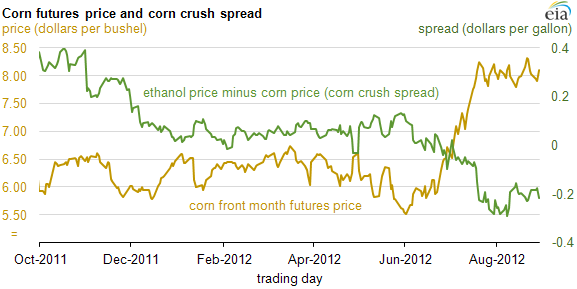
Drought conditions in Midwestern states have reduced expectations for the amount of corn that may be harvested in 2012, and contributed to a 35% rise in the price of corn from June 18 to August 29. During the same time period, the spread between ethanol and corn prices (known as the 'crush spread') declined by $0.22 dollars per gallon.
The corn crush spread indicates the relative profitability of producing ethanol from corn. The spread is calculated as the per bushel price of corn divided by 2.8, reflecting the average number of gallons of ethanol produced from a bushel of corn in a modern ethanol plant, and subtracted from the per gallon price of ethanol. A negative spread does not necessarily mean that producers are losing money by making ethanol since the leftover feedstock and other by-products can be sold. However, the $0.22 per gallon drop in the spread since early June has reduced profitability.
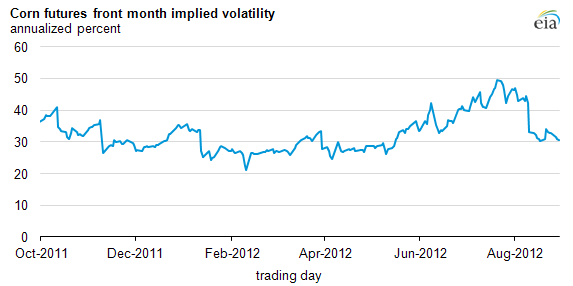
In addition to price, implied volatility (a forward-looking, market-derived measure of price uncertainty) moved higher for corn futures, an indication of a sudden supply disruption. Implied volatility for the front month corn futures contract increased by 14.3 percentage points from June 18 to July 20, settling at its 2012 peak of 49.4% on July 20. The increase in price and implied volatility for corn was primarily due to current drought conditions in the U.S. It was similar to the increases seen in crude oil prices and implied volatility during the first quarter of 2011, when a sudden change in supply expectations occurred as a result of the conflict in Libya and elevated geopolitical risks in other oil producing countries. The recent drop in corn implied volatility may reflect less uncertainty about continued drought conditions.
Ethanol is a component of gasoline after blending; however there is little evidence of the rising corn prices affecting the current price of gasoline. The ratio of the price of gasoline to the price of petroleum (called a crack spread) has remained relatively constant, indicating that the rise in cost of gasoline was largely due to the rise in cost of crude oil and not because of issues specifically related to the gasoline or ethanol markets. The recent increases in gasoline crack spreads experienced over the last week can be attributed to weather and refinery outages.
The impact of the drought on various financial markets was the subject of a special Market Prices and Uncertainty Report, a regular supplement to the Short-Term Energy Outlook.
Tags: crack spread, ethanol, financial markets, futures, prices, renewables