EIA projections for carbon dioxide emissions reflect changes in key drivers
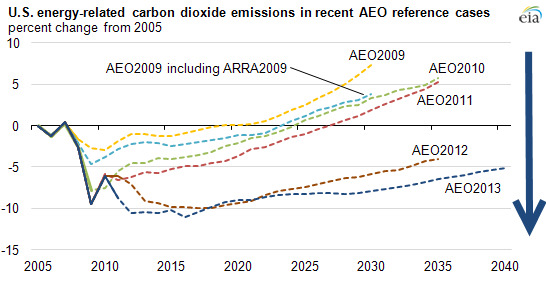
Note: Solid portions of each series show history as of each publication; dotted portions show projections. ARRA2009 denotes the American Recovery and Reinvestment Act of 2009.
Projections for U.S. energy-related carbon dioxide (CO2) emissions have generally been lowered in recent editions of the Annual Energy Outlook (AEO), the long-term projections of the U.S. Energy Information Administration. The lowered projections reflect both market and policy developments that have reduced recent and projected growth in energy demand and its expected carbon intensity. The chart presents projected energy-related CO2 emissions from AEOs issued since 2009 in terms of changes relative to emissions in 2005, a commonly used comparison year, particularly with regard to mitigation targets.
EIA's AEO reflects laws and regulations in place at the time the analysis was performed. New policies are incorporated in subsequent editions of the AEO as they are put in place. For example, updated fuel efficiency standards for light-duty and heavy-duty vehicles were incorporated in AEO2012 and AEO2013, tending to lower CO2 emissions relative to earlier projections. The CO2 projection in AEO2013 generally falls below that in AEO2012, and remains more than 5 percent below the 2005 level throughout a forecast horizon that for the first time extends to 2040. However, near-term expectations of industrial growth in response to the availability of low-priced natural gas result in somewhat higher projected levels of CO2 emissions at the end of the current decade than in last year's outlook.
From 2009 to 2013, key changes in the AEO include:
- Downward revisions in the economic growth outlook, which dampens energy demand growth
- Lower transportation sector consumption of conventional fuels based on updated fuel economy standards, increased penetration of alternative fuels, and more modest growth in light-duty vehicle miles traveled
- Generally higher energy prices, with the notable exception of natural gas, where recent and projected prices reflect the development of shale gas resources
- Slower growth in electricity demand and increased use of low-carbon fuels for generation
- Increased use of natural gas
Power sector transformation, based on decarbonization of the generation mix, occurs because natural gas and renewables gain market share at the expense of coal, reflecting:
- Resource economics—high domestic production of natural gas at historically low prices, reflecting increased production of shale gas
- Regulation—updated state renewable portfolio standards and efficiency standards, and cap-and-trade provisions of California Assembly Bill 32, as well as implementation of federal policies to reduce sulfur dioxide and nitrogen oxide emissions, the Mercury and Air Toxics Standards and other policies and measures at local, state, and federal levels
In addition to publishing the Annual Energy Outlook, EIA also creates a report evaluating how our projections of key energy concepts compare with realized outcomes. The AEO Retrospective Review includes additional analysis of past projections of CO2 emissions and other energy indicators like consumption, production, and prices.