Projected natural gas prices depend on shale gas resource economics
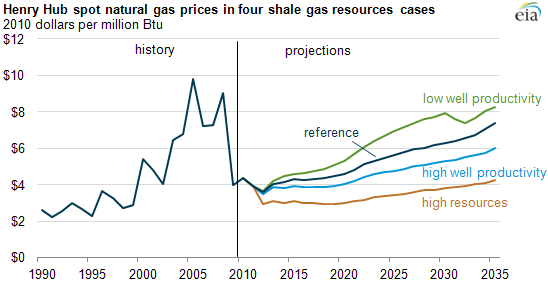
Considerable uncertainty exists regarding the size of the economically recoverable U.S. shale gas resource base and the cost of producing those resources. Across four shale gas resource scenarios from the Annual Energy Outlook 2012 (AEO2012), natural gas prices vary by about $4 per million British thermal units (MMBtu) in 2035, demonstrating the significant impact that shale gas resource uncertainty has in determining future natural gas prices. This uncertainty exists primarily because shale gas wells exhibit a wide variation in their initial production rate, rate of decline, and estimated ultimate recovery per well (or EUR, which is the expected cumulative production over the life of a well).
If a resource assessment of a shale formation relies on "sweet spot" production rates, where wells produce at rates higher than expected elsewhere in the formation, then the productive and economic potential of the entire formation could be exaggerated. On the other hand, future technological improvements that reduce production costs and/or enhance well productivity, along with closer well spacing, would increase the economic potential and resource recovery of the U.S. shale gas formations.
AEO2012 includes an analysis of varying future shale gas well production estimates and the associated EUR, along with a change in shale gas well spacing, to test the influence of shale gas resource uncertainty on future natural gas prices. In addition to the reference case, the three AEO2012 shale gas resource scenarios are:
- Low well productivity case (green line in chart). The EUR per shale gas well is assumed to be 50% lower than in the Reference case, nearly doubling the per-unit cost of developing the resource. Unproved shale gas resources are reduced to 241 trillion cubic feet (as of January 1, 2010), as compared with 482 trillion cubic feet of unproved shale gas resources in the Reference case.
- High well productivity case (light blue line). The EUR per shale gas well is assumed to be 50% higher than in the Reference case, nearly halving the per-unit cost of developing the resource. Unproved shale gas resources are increased to 723 trillion cubic feet.
- High resources case (orange line). The well spacing for all shale gas plays is assumed to be 8 wells per square mile, which increases the well density in about half the shale gas plays, and the EUR per shale gas well is also assumed to be 50% higher than in the Reference case. Unproved shale gas resources are increased to 1,091 trillion cubic feet, more than twice the unproved shale gas resources in the Reference case.
These cases do not represent a confidence interval for the shale gas resource base, but rather illustrate how different assumptions can affect projections of domestic production, prices, and consumption.
U.S. natural gas prices are determined by supply and demand conditions in the North American natural gas market, in which the United States constitutes the largest regional submarket. Future natural gas prices reflect the cost of developing incremental production capacity. Because shale gas production is projected to be a large proportion of U.S. and North American gas production, changes in the cost and productivity of U.S. shale gas wells have a significant effect on projected natural gas prices. In the Reference case, for example, shale gas production accounts for 49% of total U.S. natural gas production in 2035.
In 2031, natural gas prices dip in the low EUR case as model results reflect completion of an Alaska gas pipeline, which would transport about 1.6 trillion cubic feet per year of gas from the North Slope to the lower 48 states. Because an Alaska gas pipeline would make up for some of the reduction in lower 48 states' shale gas production, the difference between projected prices in the Reference and Low EUR case is reduced after the pipeline is completed.