U.S. crude oil production in first quarter of 2012 highest in 14 years
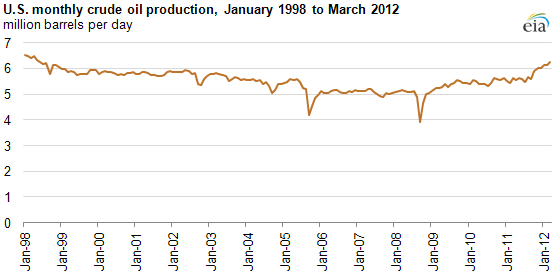
Strong growth in U.S. crude oil production since the fourth quarter of 2011 is due mainly to higher output from North Dakota, Texas,and federal leases in the Gulf of Mexico, with total U.S. production during the first quarter of 2012 topping 6 million barrels per day (bbl/d) for the first time in 14 years.
After remaining steady between 5.5 million and 5.6 million bbl/d during each of the first three quarters of 2011, EIA estimates that U.S. average quarterly oil production grew to over 5.9 million bbl/d during the fourth quarter and then surpassed 6 million bbl/d during the first quarter of 2012, according to the latest output estimates from EIA's May Petroleum Supply Monthly report (see chart below). The last time U.S. quarterly oil production was above 6 million bbl/d was during October-December 1998.
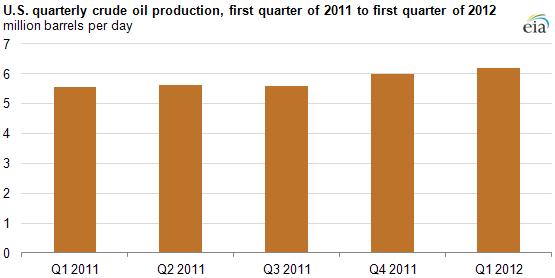
The roughly 6% growth in U.S. oil production from October 2011 through March 2012 is largely the result of increases in oil output in North Dakota, Texas, and the Gulf of Mexico. After passing California in December 2011 to become the third largest oil producing state, North Dakota then jumped ahead of Alaska in March 2012 as the state with the second largest oil output. Texas remains far ahead in the number one production spot.