Warm weather and low natural gas prices dampen spot electricity prices this winter
The combination of one of the warmest winters (November-March) in decades and low spot natural gas prices contributed to low wholesale electric prices at major market locations during the winter of 2011-2012 (see chart below). Warm weather kept electric system load low across the East Coast and helped dampen the need for coal-fired generation. Natural gas generation was up significantly to take advantage of low natural gas prices. Reduced nuclear generation due to outages and reduced hydropower generation both served to moderate declining electricity prices in much of the country.
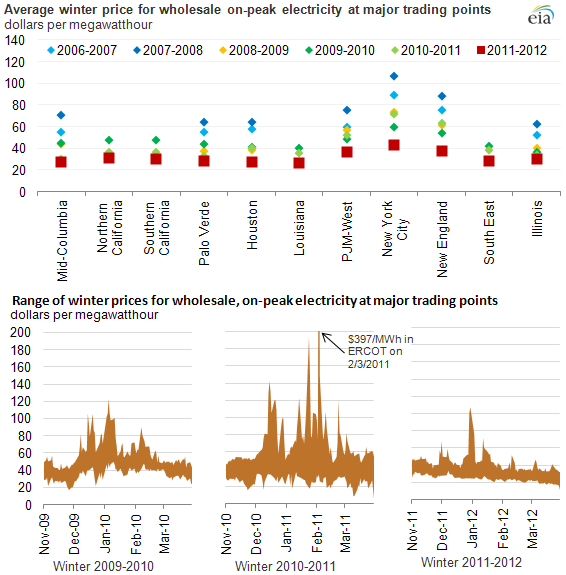
Note: Data include day-ahead, on-peak prices from Mid-Columbia (near the Washington and Oregon border), CAISO NP-15 (northern California), CAISO SP-15 (southern California), Palo Verde (in southwest Arizona), PJM N. Illinois Hub (northern Illinois), ERCOT Houston Zone, Entergy (Louisiana), PJM Western Hub, NYISO Zone J (New York City), NE-ISO Mass Hub (New England), MISO Illinois Hub (Illinois), and Into Southern (Southeast) pricing points.
On-peak, wholesale electricity prices generally ranged from $20-$50 per megawatt hour last winter, with some exceptions. Electricity prices dropped during the winter, especially starting in January, as spot natural gas prices neared their lowest levels in the past decade.
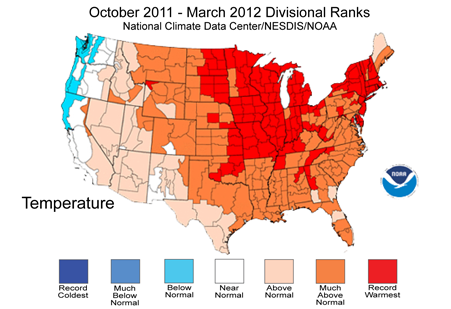
Much of the United States saw warmer-than-normal weather during the winter of 2011-2012. The national population-weighted heating-degree days (HDDs) were down 13 to 36% relative to normal weather from November to March. Every part of the country was warmer than normal for the winter except the Pacific region, which was just slightly (2%) cooler than normal, but even in the Pacific region winter load was down.
While the percentage of buildings heated with electricity is smallest in the coldest regions of the country, electric power prices are nonetheless often tied to winter weather. This is because power prices often reflect the operating costs of marginal natural gas generators, and natural gas fuel prices are keenly sensitive to winter weather (colder temperatures mean more gas burned for space heating).
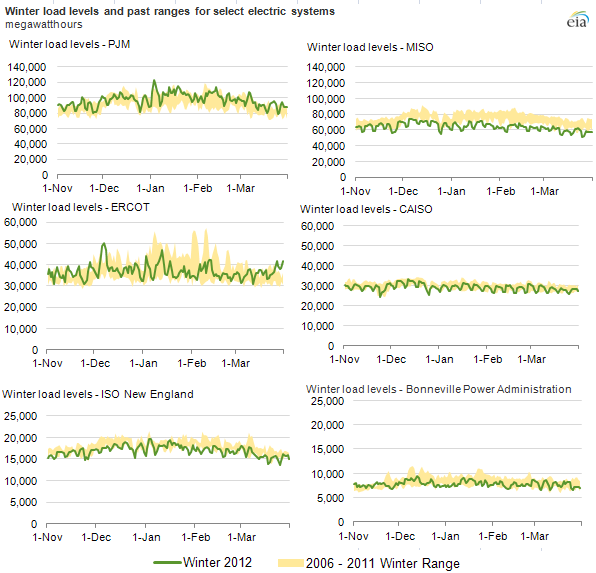
Electric system load was below the five-year average for winter months in New England, the Pacific Northwest, California and much of the central United States (MISO). Winter load levels were elevated in PJM compared to previous years. However, the system footprint of PJM has expanded over time making comparisons difficult. The ERCOT system has seen load growth as well, but unlike PJM, this was due to population and industrial demand growth in Texas. System demand in the Bonneville Power Administration was near the bottom of the five-year average although temperatures were slightly below normal. Spikes in winter demand for electricity are less common in the Bonneville system due to the generally temperate climate in the Pacific Northwest.
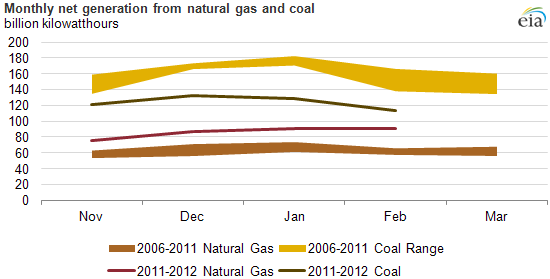
Natural gas generation during the winter of 2011/2012 (November through February, the latest electric power data available) was up 69 billion kilowatthours compared to the prior winter, despite the generally low demand for electricity. Natural gas generation climbed far above the five-year range, especially starting in January when spot natural gas prices began to fall. At the start of winter 2011/12 spot natural gas prices at Henry Hub were about $3.50/MMBtu—low by recent historic levels. By the end of winter, spot natural gas prices were heading under $2/MMBtu, nearing 10-year lows.
Coal generation, on the other hand, for the same period was much lower than the most recent five-year range. In November and December 2011, coal's share of total U.S. electricity generation fell to its lowest monthly level since 1978.
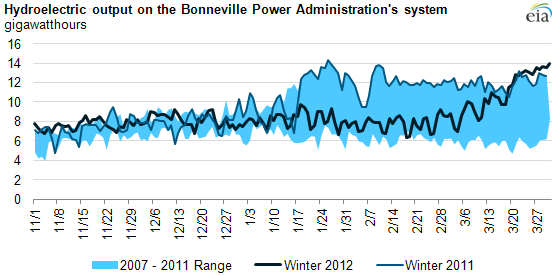
Hydroelectric output in the Pacific Northwest was near the five-year average and well below the record levels of last year. Because of the significant hydroelectric capacity in the Pacific Northwest, the level of hydroelectric output can have significant price effects throughout the Western Interconnection.
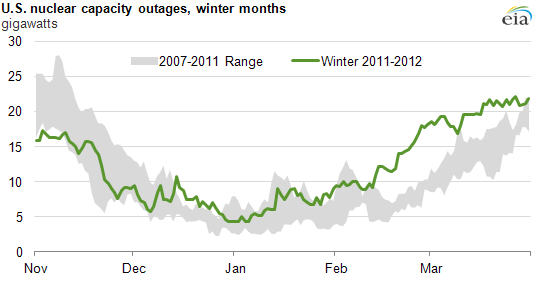
Nuclear power plants outages were elevated in the late winter and early spring due to the combination of several forced outages and the start of the spring refueling cycle. Because of the low fuel cost and high utilization rates for operating nuclear plants, an extended nuclear outage can have significant electricity market effects.
Tags: coal, consumption/demand, electricity, hydroelectric, natural gas, nuclear, Oregon, prices, spot prices, Washington, weather