2011 Brief: Energy commodity price trends varied widely during 2011
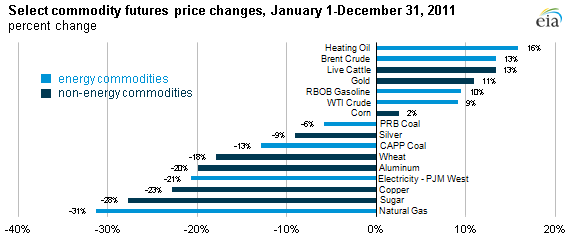
Note: Price changes are derived by taking the difference in prompt contract price for each commodity between January 1 and December 31, 2011. This method allows for comparisons of different commodity classes on a consistent basis. PRB Coal is Powder River Basin Coal. CAPP Coal is Central Appalachia Coal. WTI is West Texas Intermediate, a benchmark for both physical and financial crude oil pricing located in Cushing, Oklahoma. RBOB Gasoline is a kind of gasoline based on a reformulated blendstock for oxygenate blending (RBOB).
This article is the first in a series of briefs on energy market trends in 2011.
Crude oil and petroleum products led energy commodity price increases during 2011, but natural gas prices declined sharply. Overall, energy commodity price trends during 2011 varied widely: Brent crude oil, heating oil, West Texas Intermediate (WTI) crude oil, and gasoline (RBOB) all increased while natural gas, coal, and electricity all declined.
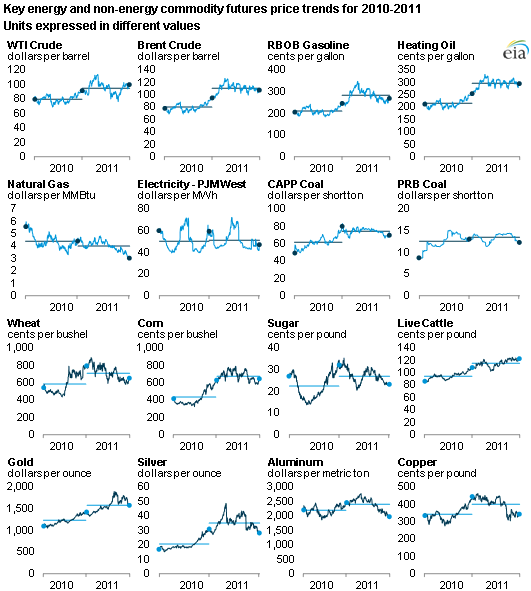
In 2011, prices fell for most commodities from the start of the year to the end of the year, but the average price (the horizontal bars in the charts) for all commodities rose in 2011 compared to 2010 except for natural gas.
During the next few days, Today in Energy articles will focus on key energy commodity price trends in 2011. Today's overview relies upon near-month contract or futures prices to ensure comparability across commodities; most other articles in this series will focus on spot market trends. Key findings from the forthcoming articles include:
Natural Gas
- Prices at the Henry Hub, a key benchmark location for pricing throughout the United States, fell from $4.37 per MMBtu in 2010 to $3.98 per MMBtu in 2011, the lowest annual average price for natural gas since 2002.
- Abundant production kept natural gas prices relatively low.
- High natural gas liquids prices drew producers to liquids-rich shale plays, such as the Marcellus and Eagle Ford.
Crude Oil
- Brent averaged about $111 per barrel, marking the first time the global benchmark averaged more than $100 per barrel for a year.
- WTI averaged about $95 per barrel in 2011, short of breaking its record annual average set in 2008, but still up $15 a barrel over 2010.
- Transportation bottlenecks near Cushing, Oklahoma contributed to a record spread between Brent and WTI prices.
Petroleum Products
- The national average pump price for gasoline and diesel during 2011 never fell below $3 a gallon, marking the first time the national pump price for both transportation fuels topped that level throughout a calendar year.
- U.S. exports of gasoline and distillates, which were mostly diesel fuel, reached record levels in 2011. As a result, the United States became a net exporter of petroleum product for the first time since 1949.
Electricity
- Average, on-peak, day-ahead electricity prices were lower across most of the United States in 2011, with many markets mirroring the decline in natural gas prices.
- ERCOT (most of Texas) experienced record-breaking load levels and unprecedented day-ahead prices due to sustained, extreme heat and shortages of electric generation supply.
- In the West, significant hydroelectric supply in the Northwest lowered average wholesale power prices in Washington, Oregon, and Northern California.
Coal
- Through October 2011 (latest data available), average delivered coal prices to electric utilities in the United States were up about 6% compared to the same period for 2010.
- U.S. total coal production was relatively unchanged in 2011, and estimated coal stockpiles for electric generators fell from about 175 million short tons to about 157 million short tons, or 11%, comparing October 2010 to October 2011 (latest EIA data available).
- Record coal exports contributed to higher wholesale prices for Eastern coal.