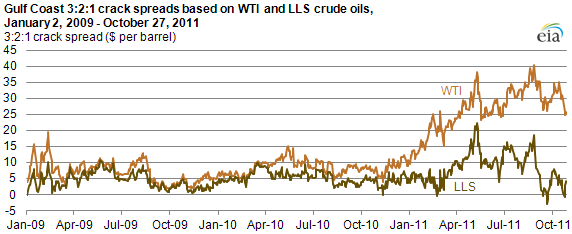
3:2:1 Crack spreads based on WTI & LLS crude oils have diverged in 2011
Relatively lower prices for West Texas Intermediate (WTI) crude oil compared to other crude oil prices make wholesale refinery margins (the difference between the value of refining inputs and outputs that is available to cover refining costs and profits) using the WTI price appear higher than refinery margins using other indices. Looking at crack spreads shows why. The 3-2-1 crack spread is the difference between the market value of the key refinery input (crude oil) and the two key refinery outputs (gasoline and diesel fuel) weighted in rough proportion to their shares of production. Crack spreads based on WTI crude oil have been considerably higher than those based on other crude oils this year. Using a WTI crack spread for a refinery that uses other crude oils, like Louisiana Light Sweet (LLS), has become misleading.
Through October 27, 2011, the 3:2:1 crack spread based on WTI has averaged almost $27 per barrel in 2011, while the same spread based on LLS crude oil has only averaged about $8 per barrel. LLS is a crude oil processed by a number of U.S. refineries and has characteristics similar to those of WTI. In 2010, the WTI and LLS 3:2:1 crack spreads were about $9 per barrel and $5 per barrel, respectively.
Crack spreads are an estimator of refining margins; they do not take into consideration all refinery product revenues and exclude refining costs other than the cost of crude oil. However, crude oil is the major variable cost that refiners face, and there are only a handful of refineries (mostly in the Midwest) with pipeline access to Cushing, Oklahoma—an important crude oil storage location and the delivery point for the NYMEX crude oil contract—and its relatively cheap crude oil. Thus, basing a crack spread on WTI is not representative of the margins for most U.S. refiners, especially those on the Gulf Coast, which is where about 50% of U.S. refining capacity is located.
Crack spreads based on LLS provide a better margin estimate for Gulf Coast refineries. Historically, such distinctions were not necessary as the prices of WTI and other similar crude oils moved together. However, due to the current price divergence of WTI and LLS, it is necessary to make these distinctions in order to properly reflect the current refining market.
The WTI-LLS difference reached record levels in 2011 as a result of both WTI weakness and LLS strength. WTI prices have shown persistent weakness after inventories piled up early in the year because of increased crude oil flows into Cushing from the Bakken shale formation and from Canada. However, because of transportation outflow constraints, it has been difficult to move these volumes to the refineries on the Gulf Coast. At the same time, the peak loss of 1.5 million barrels per day (bbl/d) of Libyan crude oil from the international market created tight supply conditions for light, sweet crude oil, especially in Europe. This loss of supply drove up the price of not only European crudes such as Brent, but also of U.S. Gulf Coast grades, such as LLS, which compete with imported grades whose prices are linked to Brent prices.
With Libyan crude production only beginning to recover, lingering effects from production issues in the North Sea (the source of Brent) and low European crude inventories, the market is still coping with relatively tight supply conditions. The lack of southward pipelines affects the ability to move WTI crude oil from Cushing to refineries in the Gulf Coast to compete with higher priced grades in the area, although increasing volumes are making the trip out of the Midwest.