Released: September 8, 2011
Next Release: September 14, 2011
The Latest Twist in Oil Price Patterns
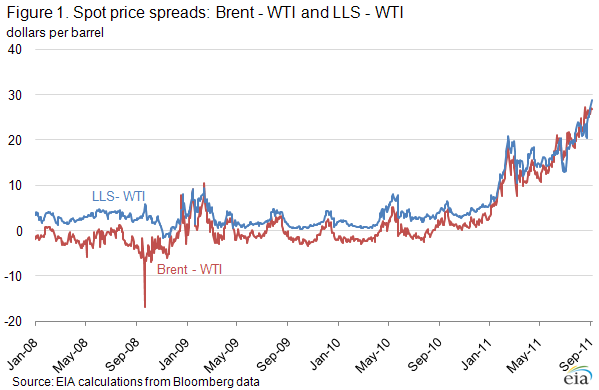
Since the beginning of the year, a defining feature of the oil market has been the apparent "disconnect" between prices for West Texas Intermediate (WTI) and those for other crude oil grades. Prices for WTI have been trading at an ever widening discount to those of other grades, such as North Sea Brent, a close WTI look-alike in terms of gravity and sulfur content (Figure 1). The WTI futures curve and that of Brent futures also have parted ways: WTI futures remain in contango, meaning that prices for nearby contracts trade at a discount to those for later delivery, while Brent futures have swung into backwardation (prompt barrels trading at a premium to deferred ones). Recently the discount of WTI futures to Brent futures, a closely watched market indicator, has reached a record-high level. EIA's newly released Short-Term Energy Outlook (STEO) expects a large WTI discount to persist through the end of 2012. Recent market developments, however, warrant a fresh look at its likely causes.
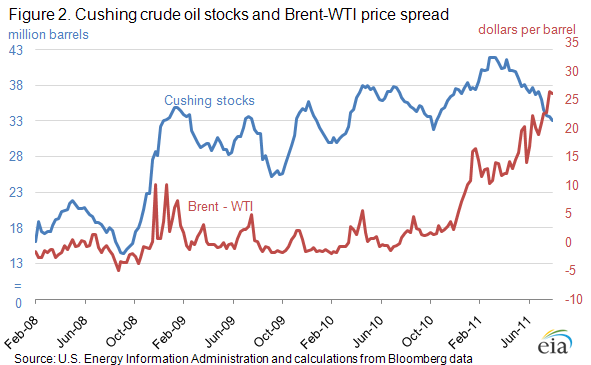
Historically, periods of WTI discount versus Brent have generally been associated with a buildup in inventories at Cushing, OK, the delivery point of the NYMEX crude futures contract. It was thus not surprising that the recent widening of the WTI discount initially coincided with an unprecedented buildup in Cushing crude stocks (Figure 2), thanks to both surging domestic and imported crude supply in the Midwest and a significant expansion of local storage capacity. Seeking to explain the price discrepancy between Cushing and other crude grades, analysts pointed to a lack of pipelines out of Cushing that, in effect, stranded rising crude supplies in the landlocked Cushing and broader Midwestern markets, causing stocks to rise.
Also, any increase in the WTI-Brent spread has traditionally been associated with a corresponding shift in the WTI time structure: the spread between front-month and second-month WTI generally closely tracks that between front-month Brent and front-month WTI (Figure 3). That makes sense, given the transit time to move Brent barrels from the North Sea to the U.S. Midwest.
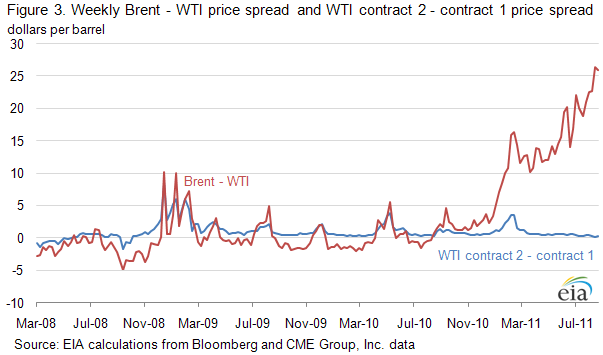
But neither of these features is evident in recent market trends. Far from building further, in line with the widening of the WTI discount, Cushing crude stocks have been falling fast in the last few months. At latest count, Cushing stocks were more than 9 million barrels below their early-April peaks - a reversal in inventory trends that has not stopped the WTI discount from widening further (Figure 2). Meanwhile, WTI "time spreads" - the price difference between prompt WTI barrels and WTI supplies for later delivery - have not kept up with the Brent-WTI spread. The contango in WTI futures has shrunk, with front-month WTI trading at a narrowing discount to the second-month contract, while the Brent-WTI spread has taken off - a development that normally would portend a widening WTI contango (see Figure 3).
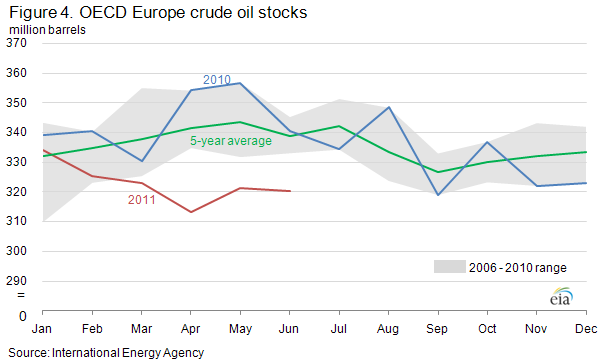
Two considerations may help make sense of these somewhat counterintuitive developments. First, it may help to look beyond U.S. inventories and consider the stock situation in Brent's own regional market. As reflected in the steep backwardation in Brent futures markets, the European crude market continues to face very tight supply conditions. The disruption in Libyan crude exports, most of which normally end up at European refineries, drew European crude stocks well below their normal range (see Figure 4). Despite the release of oil from International Energy Agency strategic storage and increased Saudi exports, the tight crude oil supply situation in Europe has blunted the downward price impact of weak economic recovery. Current supply conditions in Europe have had as much impact on the transatlantic arbitrage and Brent-WTI spread as the buildup of excess supply in Cushing.
Second, rising inventories at Cushing should not be seen, in this case, as the exclusive, primary driver of the WTI price discount, but rather as a secondary symptom of underlying transportation bottlenecks. Those bottlenecks, which have been the real root cause of recent relative WTI price weakness, can also manifest themselves in other ways, such as rising transportation costs.
Bottlenecks are not airtight: depending on the pull from other markets, some oil can seep through, but at a cost. Such has been the case of the Cushing storage hub and the broader Midwestern market, from which rail, barge and truck shipments of crude have been on the rise. The greater the pull on Midwest crude supplies, the higher the transportation costs, as the least expensive ways out of the Midwest are tapped first and transportation costs increase for the marginal barrel.
Logistical bottlenecks hindering crude flows from Cushing and the Midwest to the U.S. Gulf Coast can be seen as the primary factor of the WTI disconnect, whether they express themselves through stock builds and an associated increase in marginal storage costs (thus increasing the slope of the contango), or through stock draws and a ramp-up in marginal transport costs (causing "location spreads" to widen). Notwithstanding the recent decline in Cushing inventories as markets resort to premium-cost transportation capacity to move discounted WTI crude, such capacity is itself constrained and may soon be overwhelmed by renewed growth in exports from Canada or regional refinery maintenance. Pipeline companies are going ahead with plans to add capacity out of the region, whether through new, dedicated lines (Keystone XL, awaiting regulatory approval) or by reversing and/or expanding existing infrastructure, as Magellan and others have announced. Until such plans come closer to being realized, or the crude supply balance in Europe significantly improves, the WTI discount will likely persist and perhaps widen further.
Gasoline and diesel prices advance for second straight week
The U.S. average retail price of regular gasoline increased this week, adding almost a nickel to reach $3.67 per gallon. The average price is $0.99 per gallon higher than last year at this time. The largest increase came on the West Coast where prices gained more than eleven cents per gallon over last week; the average price in region is now $3.86 per gallon, the most expensive in the country. The average price in the Rocky Mountain region gained an even four cents per gallon on the week. Moving east, average prices in the Midwest and on the East Coast rose 3-4 cents per gallon. Rounding out the regions, the Gulf Coast saw prices add about two cents per gallon to remain the least expensive in the country at $3.49 per gallon.
Similar to gasoline, the national average diesel price climbed almost a nickel to $3.87 per gallon. The diesel price is $0.94 per gallon higher than last year at this time. The West Coast average diesel price gained more than seven cents per gallon, the largest regional increase for the week. The Rocky Mountains followed, adding more than five cents to last week's price, while the Midwest registered an increase of just under five cents per gallon. The East Coast and Gulf Coast each saw price increases of about four cents per gallon.
Propane inventories level out
Last week, U.S. inventories of propane began to level out as the re-stocking season draws to an end. Total U.S. propane stocks drew slightly to end at 53.6 million barrels. Midwest regional propane inventories decreased by 1.1 million barrels, while Gulf Coast stocks increased by 1.0 million barrels. Rocky Mountain/West Coast regional stocks also grew by 0.1 million barrels, while East Coast inventories drew slightly. Propylene non-fuel use inventories represented 5.5 percent of total propane inventories.
Text from the previous editions of This Week In Petroleum is accessible through a link at the top right-hand corner of this page.
 |
 |
||||||
| Retail Data | Changes From | Retail Data | Changes From | ||||
| 09/05/11 | Week | Year | 09/05/11 | Week | Year | ||
| Gasoline | 3.674 | Diesel Fuel | 3.868 | ||||
 |
 |
||||||||||||||||||||||||||
|
 |
||||||||||||||||||||||||||
| *Note: Crude Oil Price in Dollars per Barrel. | |||||||||||||||||||||||||||
 |
 |
||||||
 |
 |
||||||
| Stocks Data | Changes From | Stocks Data | Changes From | ||||
| 09/02/11 | Week | Year | 09/02/11 | Week | Year | ||
| Crude Oil | 353.1 | Distillate | 156.8 | ||||
| Gasoline | 208.8 | Propane | 53.561 | ||||