Expanded Panama Canal reduces travel time for shipments of U.S. LNG to Asian markets
Note: Calculations assume export from the Sabine Pass liquefaction terminal at an average LNG Carrier speed of 19.5 knots and one-day transit time through the Panama and Suez Canals.
The newly expanded Panama Canal will be able to accommodate 90% of the world's current liquefied natural gas (LNG) tankers with LNG-carrying capacity up to 3.9 billion cubic feet (Bcf). Prior to the expansion, only 30 of the smallest LNG tankers (6% of the current global fleet) with capacities up to 0.7 Bcf could transit the canal. The expansion has significant implications for LNG trade, reducing travel time and transportation costs for LNG shipments from the U.S. Gulf Coast to key markets in Asia and providing additional access to previously regionalized LNG markets.
The new locks in the canal provide access to a wider lane for vessels and are 180 feet across, compared with 109 feet in the original locks. Only the 45 largest LNG vessels, 4.5-Bcf to 5.7-Bcf capacity Q-Flex and Q-Max tankers used for exports from Qatar, will not be able to use the expanded canal.
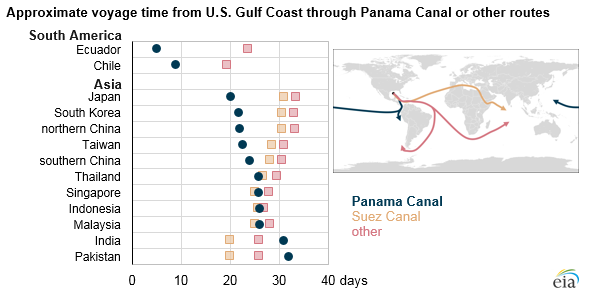
Transit through the Panama Canal will considerably reduce voyage time for LNG from the U.S Gulf Coast to markets in northern Asia. Four countries in northern Asia—Japan, South Korea, China, and Taiwan—collectively account for almost two-thirds of global LNG imports. A transit from the U.S. Gulf Coast through the Panama Canal to Japan will reduce voyage time to 20 days, compared to 34 days for voyages around the southern tip of Africa or 31 days if transiting through the Suez Canal. Voyage time to South Korea, China, and Taiwan will also be reduced by transiting through the Panama Canal.
The wider Panama Canal will also considerably reduce travel time from the U.S. Gulf Coast to South America, declining from 20 days to 8-9 days to Chilean regasification terminals, and from 25 days to 5 days to prospective terminals in Colombia and Ecuador. For markets west of northern Asia, including India and Pakistan, transiting the Panama Canal will take longer than either transiting the Suez Canal or going around the southern tip of Africa.
In addition to shortening transit times, using the Panama Canal will also reduce transportation costs. The Panama Canal Authority has introduced new toll structures for LNG vessels designed to encourage additional LNG traffic through the Canal, especially for round trips. Transit costs through the Panama Canal for an average 3.5 Bcf LNG carrier are estimated at $0.20 per million British thermal units (MMBtu) for a round-trip voyage, representing about 9% to 12% of the round-trip voyage cost to countries in northern Asia.
Based on IHS data, the round trip voyage cost for ships traveling from the U.S. Gulf Coast and transiting the Panama Canal to countries in northern Asia is estimated to be $0.30/MMBtu to $0.80/MMBtu lower than transiting through the Suez Canal and $0.20/MMBtu to $0.70/MMBtu lower than traveling around the southern tip of Africa. Transiting the Panama Canal offers reduction in transportation costs to northern Asian countries such as Japan, South Korea, Taiwan, and China and may offer some minimal cost reductions to countries in southeast Asia (Malaysia, Thailand, Indonesia, and Singapore), depending on transit time. U.S. LNG exports to India, Pakistan, and the Middle East are not expected to flow through the Panama Canal because alternative routes, either the Suez Canal or around the southern tip of Africa, have lower transportation costs.
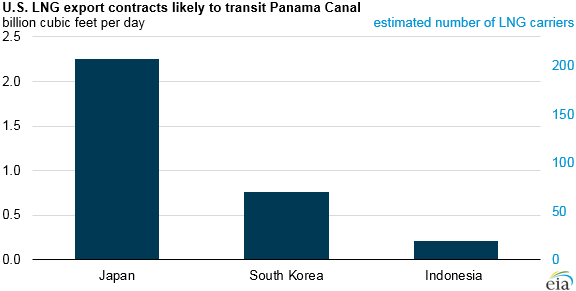
Currently, about 9.2 billion cubic feet per day (Bcf/d) of U.S. natural gas liquefaction capacity is either in operation or under construction in the United States. By 2020, the United States is set to become the world's third-largest LNG producer, after Australia and Qatar. More than 4.0 Bcf/d of U.S. liquefaction capacity has long-term (20 years) contracts with markets in Asia, of which 3.2 Bcf/d is contracted to Japan, South Korea, and Indonesia.
Note: Calculations of the number of vessels transiting Panama Canal assume the largest LNG vessel size allowed to transit the expanded Canal (approximate LNG-carrying capacity 3.9 Bcf).
An additional 2.9 Bcf/d of U.S. liquefaction capacity currently under construction has been contracted long-term to various countries. Flexibility in destination clauses allows these contracted volumes to be taken to any LNG market in the world. Assuming all contracted volumes transit the Panama Canal, EIA estimates that LNG traffic through the Canal could reach more than 550 vessels annually, or 1-2 vessels per day, by 2021.
Principal contributor: Victoria Zaretskaya