Industrial and electric power sectors drive projected growth in U.S. natural gas use
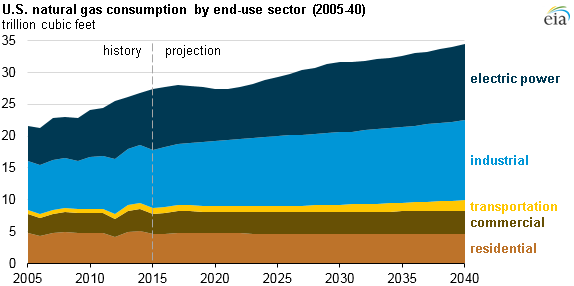
U.S. consumption of natural gas is projected to rise from 28 trillion cubic feet (Tcf) in 2015 to 34 Tcf in 2040, an average increase of about 1% annually, according to EIA's Annual Energy Outlook 2016 (AEO2016) Reference case. The industrial and electric power sectors make up 49% and 34% of this growth, respectively, while consumption growth in the residential, commercial, and transportation sectors is much lower.
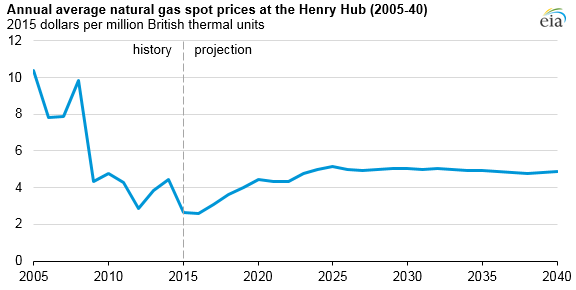
Much of this growth in natural gas consumption results from relatively low natural gas prices. In the AEO2016 Reference case, average annual U.S. natural gas prices at the Henry Hub are expected to remain around or below $5.00 per million British thermal units (MMBtu) (in 2015 dollars) through 2040. The Henry Hub spot price averaged $2.62/MMBtu in 2015, the lowest annual average price since 1995.
Prices rise through 2020 in the AEO2016 Reference case projection as natural gas demand increases, particularly for exports of liquefied natural gas (LNG). Currently, most U.S. natural gas exports are sent to Mexico by pipeline, but LNG exports, including those from several facilities currently built or under construction, account for most of the expected increases in total U.S. natural gas exports through 2020.
The persistent, relatively low price of U.S. natural gas is the primary driver for increased natural gas consumption in the industrial sector. Energy-intensive industries and those that use natural gas as a feedstock, such as bulk chemicals, make up most of the increase in natural gas consumption.
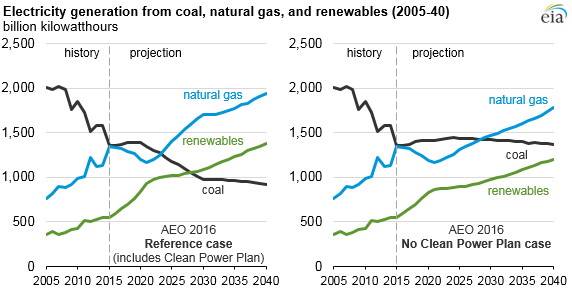
Low natural gas prices also support long-term consumption growth in the electric power sector. Natural gas use for power generation reached a record high in 2015 and is expected to be high in 2016 as well, likely surpassing coal on an annual average basis. However, a relatively steep rise in natural gas prices through 2020 (rising 11% per year) and rapid growth in renewable generation—spurred by renewable tax credits that were extended in 2015—also contribute to a decline in power generation fueled by natural gas between 2016 and 2021.
Throughout the 2020s and 2030s, electricity generation using natural gas increases again. Because natural gas-fired electricity generation produces fewer carbon dioxide emissions than coal-fired generation, natural gas is expected to play a large role in compliance with the Clean Power Plan for existing generation from fossil fuels, which takes effect in 2022. The electric power sector's total consumption of natural gas from 2020 through 2030 is 6 Tcf greater in the AEO2016 Reference case than in a case where the Clean Power Plan is not implemented (No CPP).
Natural gas use in the residential, commercial, and transportation sectors does not significantly contribute to growth in total natural gas consumption through 2040. Although natural gas use in vehicles grows rapidly, particularly beyond 2030, it only accounts for a small portion of U.S. natural gas use. Natural gas consumption through 2040 is relatively flat in the residential and commercial sectors because of increased efficiency of natural gas equipment such as furnaces and water heaters.
Principal contributor: Katie Dyl