EIA lowers crude oil price forecast through 2016
Note: Similar confidence intervals cannot be established around the Brent futures price, as trading volumes on Brent futures contracts are relatively sparse compared to WTI trading volumes.
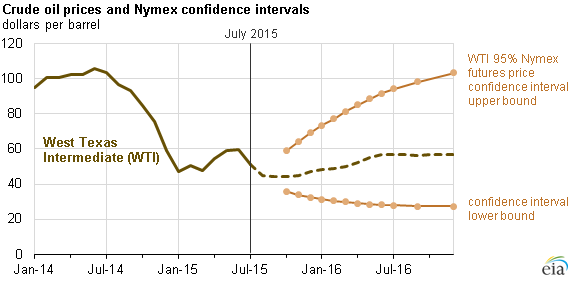
Amid high uncertainty in the global oil market, EIA has lowered crude oil price forecasts in the Short-Term Energy Outlook (STEO), expecting West Texas Intermediate (WTI) crude oil prices to average $49 per barrel (b) in 2015 and $54/b in 2016, $6/b and $8/b lower than forecast in last month's STEO, respectively. Concerns over the pace of economic growth in emerging markets, continuing (albeit slowing) supply growth, increases in global liquids inventories, and the possibility of increasing volumes of Iranian crude oil entering the market contributed to the changed forecast.
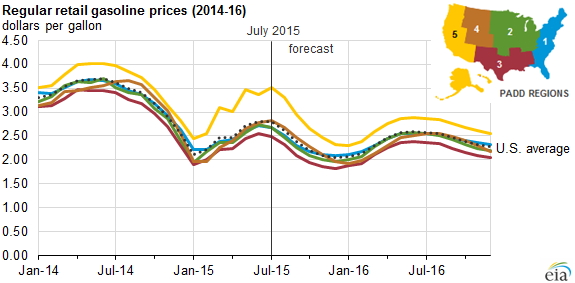
Since the beginning of 2015, North Sea Brent has traded about $5/b more than WTI, and EIA expects this $5/b price spread to persist at least through 2016. As gasoline prices tend to follow Brent crude oil prices, retail gasoline prices are expected to remain relatively low. EIA's updated projection remains subject to significant uncertainties: the pace and volume at which Iranian oil reenters the market, the strength of oil consumption growth, and the responsiveness of non-OPEC production to low oil prices.
WTI futures contracts for November 2015 delivery, traded during the five-day period ending August 6, averaged $47/b. As detailed in the August Market Prices and Uncertainty Report, current values of futures and options contracts continue to suggest high uncertainty in the crude oil price outlook. These values established the lower and upper limits of the 95% confidence interval for the market's expectations of monthly average WTI prices in November 2015 at $34/b and $64/b, respectively. The 95% confidence interval for market expectations widens over time, with lower and upper limits of $27/b and $103/b for prices in December 2016. Implied volatility now averages 37%, more than double the implied volatility average this time last year (16%).
As the price of crude oil changes, prices of wholesale, and ultimately retail, gasoline adjust to reflect crude oil costs. All other factors being equal, a $1-per-barrel change in the price of crude oil will result in a change of 2.4 cents per gallon in the price of wholesale and retail gasoline. (There are 42 gallons in a barrel, and 2.4 cents is 1/42 of $1.00.)
However, ongoing refinery outages in California and strong gasoline demand in the United States and abroad have kept gasoline prices elevated the past two months despite falling crude oil prices. U.S. regular gasoline monthly average retail prices averaged $2.79/gallon (gal) in July, with large differences in prices across regions: $2.49/gal in the Gulf Coast region to $3.51/gal in the West Coast region. Refinery outages on the West Coast have contributed to higher gasoline prices and significant price volatility. West Coast regular gasoline prices increased to a new 2015 peak of $3.60/gal on July 20, and have since fallen to $3.36/gal as of August 10. West Coast gasoline prices are expected to exceed the national average through at least 2016. In addition, gasoline prices in Chicago and elsewhere in the Midwest have risen following an unplanned outage at BP's refinery in Whiting, Indiana.
Principal contributor: Sean Hill