Hydropower has a long history in the United States
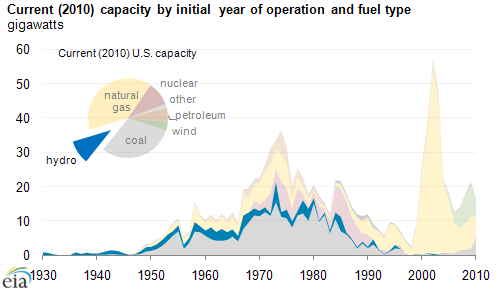
Note: Data for 2010 are preliminary. Generators with online dates earlier than 1930 are predominantly hydroelectric. Data include non-retired plants existing as of year-end 2010. This chart shows the most recent (summer) capacity data for each generator. However, this number may change over time, if a generator undergoes an uprate or derate.
Download CSV Data
The June 16 edition of Today in Energy examined the wide age range of electric power generators for all fuels; today's article looks specifically at hydropower. The U.S. hydroelectric (hydro) generating capacity inventory was established over many decades. At the end of 2009, hydro made up 10% of total U.S. electric generating capacity. Hydropower produced between 6-9% of total U.S. electric generation between 1998 and 2009, depending on water availability.
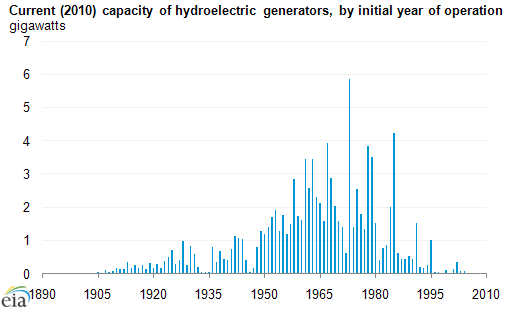
Note: Data for 2010 are preliminary. Generators with online dates earlier than 1930 are predominantly hydroelectric. Data include non-retired plants existing as of year-end 2010. This chart shows the most recent (summer) capacity data for each generator. However, this number may change over time, if a generator undergoes an uprate or derate.
Download CSV Data
At the end of 2010, hydro represented 24 of the 25 oldest operating power facilities in the United States and 72% of all electric generating capacity more than 60 years old. Unlike most other generator types, Federal entities (for example, the Bureau of Land Management) built and currently own or operate hydro facilities in many areas of the country.
Hydropower generation resources are clustered unevenly around the country, with over half of U.S. hydro capacity concentrated in three States: Washington, Oregon, and California. During the height of the spring runoff period, as snowpack is melting at the higher elevations, hydropower serves nearly all of the electric supply needs in the Pacific Northwest and provides supply to California due to relatively low operating costs and increased seasonal availabilities. Common impacts of high hydro generation include low power prices due to hydro's relatively low operating costs, low demand for natural gas for power generation, and sometimes an oversupply of generation during periods of low electricity demand.
Tags: capacity, electricity, hydroelectric, Oregon, renewables, United States, Washington