Rise in salt cavern storage capacity for natural gas offsets declines in other capacities
With natural gas storage at low levels in most of 2014 and production relatively high, minimal new natural gas storage capacity was built, except for salt facilities in the Producing region. Capacity in the East region of the United States fell slightly, resulting in relatively unchanged national total capacity.
EIA measures natural gas storage capacity in November of each year, which is typically when storage withdrawals begin to exceed storage injections. From November 2013 to November 2014, EIA found that each of EIA's two measures of storage capacity within the Lower 48 states was virtually unchanged, as increases in salt facilities largely offset declines in other types of storage capacity.
The U.S. Energy Information Administration (EIA) uses two distinct measures of natural gas storage capacity:
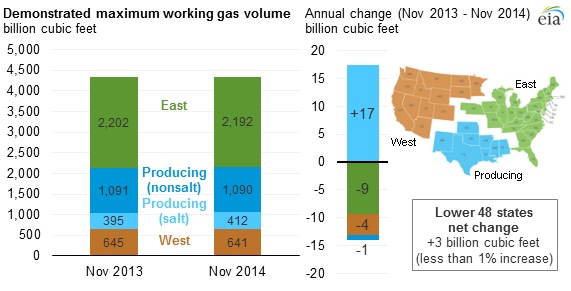
Demonstrated maximum working gas volume is the sum of peak volumes reported by the 395 active storage facilities in the Lower 48 states, regardless of when the individual peaks occurred over the five-year reporting periods ending in November 2013 and November 2014. This volume barely increased from 4,333 to 4,336 billion cubic feet between November 2013 and November 2014.
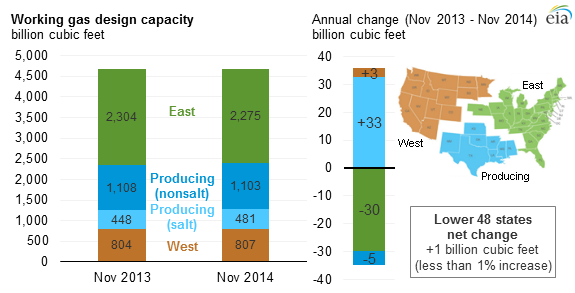
Design capacity is the sum of the working gas design capacity of the 395 active storage fields, as of November 2014, as reported on survey Form EIA-191, Monthly Underground Natural Gas Storage Report. Design capacity is based on the physical characteristics of the reservoir, installed equipment, and operating procedures particular to the site that is often certified by federal or state regulators. Design capacity also barely increased, from 4,664 to 4,665 billion cubic feet, between November 2013 and November 2014.
Two primary factors affected the modest change in capacity this year compared with previous changes:
Low storage volumes: For nearly all of 2014, and in all regions except the Producing salt region, natural gas storage levels were below the previous five-year (2009-13) minimum, after the extremely cold winter of 2013-14 led to large storage withdraws.
No new underground storage caverns: Since November 2013, no new storage facilities began operation, and any increases in working gas design capacity came from expansions to existing caverns. Capacity growth in the coming years is expected to be relatively modest and to be concentrated in salt facilities.
Principal contributor: Mike Kopalek
Tags: capacity, natural gas, storage, storage