Consumer energy expenditures are roughly 5% of disposable income, below long-term average
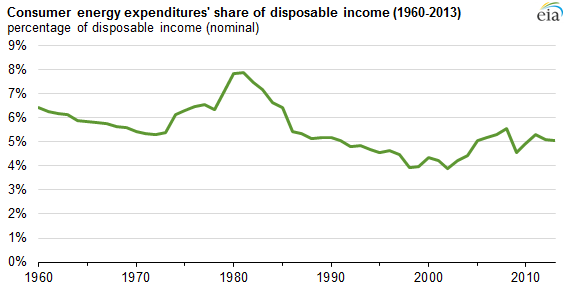
Total U.S. household energy consumption expenditures have generally declined relative to disposable income since 1960, although during periods of high energy prices, consumers devote increasing shares of their income to energy. Energy expenditures ranged between 4% and 8% of disposable income since 1960. Consumer energy expenditures today are a lower percentage of disposable income than the average from 1960 to present (5.5% average).
Consumer energy expenditures as a percent of disposable income in 2013 remain lower than the average since the 1960s, even though consumer energy prices grew faster than inflation over that period. Because electricity and transportation spending accounts for more than two-thirds of consumer energy expenditures, increasing vehicle fuel efficiencies and changing fuels used for home heating have contributed to lower consumer energy expenditures relative to disposable income.
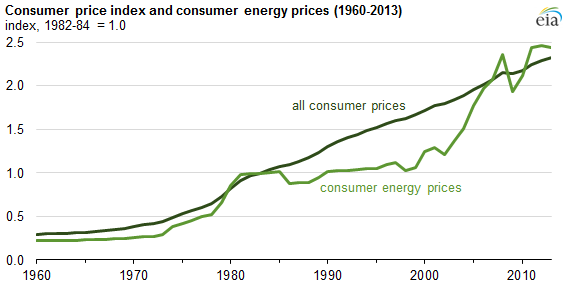
Consumer energy prices have been more volatile than overall consumer prices especially during the 1970s, early 2000s, and again in the recent recession in 2008-09. During periods when energy prices are changing rapidly, they historically have changed quicker than energy use, leading to large swings in energy expenditures as a share of disposable income.
Principal contributor: Kay Smith
Tags: consumption/demand, prices