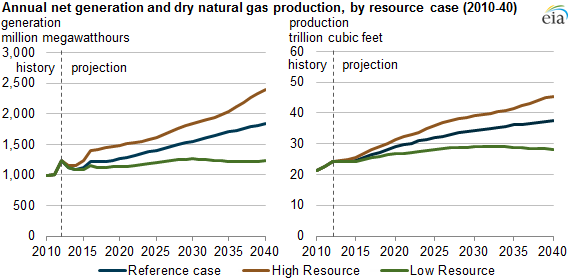
Projected growth in natural gas-fired generation is influenced by resource availability
Note: All generation values are for net generation.
Different scenarios of natural gas resource availability in the Annual Energy Outlook 2014 (AEO2014) Reference case, High Oil and Gas Resource case, and Low Oil and Gas Resource case affect the growth of natural gas-fired electric generation. As increasing amounts of natural gas become economically available to power sector and onsite generators, gas-fired electric generation increases in all three cases. However, the cases differ in terms of whether growth in gas-fired generation is sufficient to overtake coal-fired generation by 2040.
Growth in natural gas-fired generation comes from two sources: the power sector and the end-use sector. Growth in natural gas-fired generation in the power sector accounts for 78% of the overall increase in generation from that fuel through 2040 in the Reference case; growth in the end-use sector—largely firms in manufacturing industries that use natural gas-fired combined heat and power units for onsite electricity generation—accounts for the remaining 22%. Growth in natural gas-fired generation in both of these sectors results in natural gas-fired generation surpassing coal-fired generation by 2040.
By contrast, power sector growth alone is sufficient to push total natural gas-fired generation above coal-fired generation in the High Resource case. Greater resource availability, leading to a lower increase in natural gas prices, makes generation from natural gas-fired units even more economically feasible than in the Reference case. The opposite occurs in the Low Resource case, which projects that, due largely to low resource availability and a higher increase in natural gas prices than in the Reference case, total natural gas-fired generation remains below coal-fired generation through 2040.
Additional detail on these three scenarios is provided in the tabs below.
Source: U.S. Energy Information Administration, Annual Energy Outlook 2014
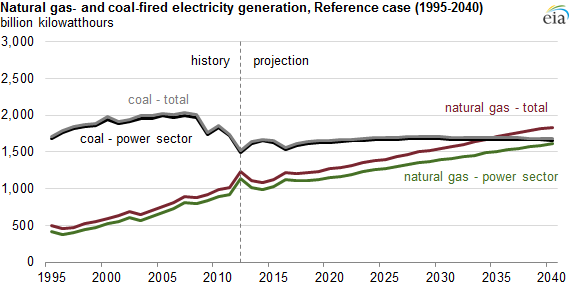
Note: The electric power sector comprises electricity-only plants and combined-heat-and-power plants whose primary business is to sell electricity, or electricity and heat, to the public. The difference between power sector generation and total generation equals end-use sector generation. All generation values are for net generation.
In the Reference case, natural gas-fired generation dips in the near term, and then it grows steadily through 2040:
- In 2012, historically low natural gas prices and decreased power generation across all fuel sources led to the lowest annual level of coal-fired generation in 25 years, while newer natural gas-fired facilities became more economical to operate. Last year, higher natural gas prices allowed coal-fired generation to regain some of its market share.
- Through 2015, coal-fired generation is projected to remain above 2012 levels, while natural gas remains below 2012 levels. The effect of higher natural gas prices is only partially offset by 22 gigawatts (GW) of coal plants that are projected to retire.
- From 2015 to 2020, environmental rules will lead to an additional 27 GW of coal retirements, of which 23 GW occur in 2016 alone. Gas-fired power generation increases by 129 billon kilowatthours, and higher demand pushes the delivered price of natural gas to the electric power sector to more than $5.00 per million British thermal units (MMBtu).
- After 2020, coal-fired generation capacity remains relatively flat, while power generators build new, more economic natural gas-fired units to meet rising overall power demand. Although the delivered price of natural gas to the power sector reaches $8.16/MMBtu in 2040, versus $3.19/MMBtu for coal, coal-fired generation includes higher construction costs and uncertainty over future environmental rules.
Source: U.S. Energy Information Administration, Annual Energy Outlook 2014
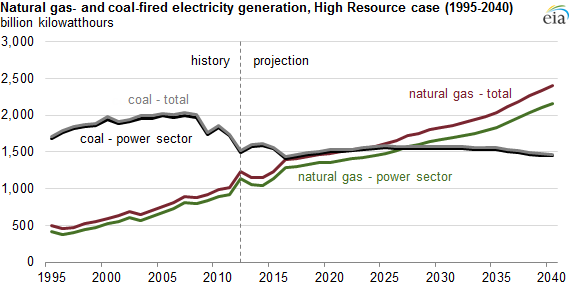
Note: The electric power sector comprises electricity-only plants and combined-heat-and-power plants whose primary business is to sell electricity, or electricity and heat, to the public. The difference between power sector generation and total generation equals end-use sector generation. All generation values are for net generation.
In the High Oil and Gas Resource case, natural gas dry production grows by a 2.3% average annual rate between 2012 and 2040, when it reaches 46 trillion cubic feet (Tcf), versus 38 Tcf in the Reference case. The High Resource case assumes higher onshore production, particularly in shale and tight gas formations, as well as higher offshore and Alaskan production.
The increased availability of natural gas in the High Resource case leads to higher exports and to higher consumption in all major domestic sectors. This includes the amount of natural gas-fired electric generation from 2012 to 2040, particularly in the electric power sector:
- As in the Reference case, natural gas-fired generation in the power sector dips in the near term, but then it increases significantly through 2040.
- The average annual rate at which natural gas-fired generation rises in the end-use sector is roughly comparable to that of the Reference case, but natural gas-fired generation in the power sector rises by 2.3% per year, versus 1.3% per year in the Reference case.
- An abundance of supply makes natural gas a relatively more economical option for electric power generators. The delivered price of natural gas to power generators does not surpass $5.00/MMBtu until 2025, versus 2018 in the Reference case, and reaches $5.17/MMBtu in 2040, 37% lower than in the Reference case.
- These lower fuel prices contribute to total natural gas-fired generation surpassing total coal-fired generation by 2024. Unlike in the Reference case, natural gas-fired generation also surpasses coal-fired generation in just the power sector, starting in 2027.
- Coal-fired retirements total 42 GW, 53% more than in the Reference case.
Source: U.S. Energy Information Administration, Annual Energy Outlook 2014
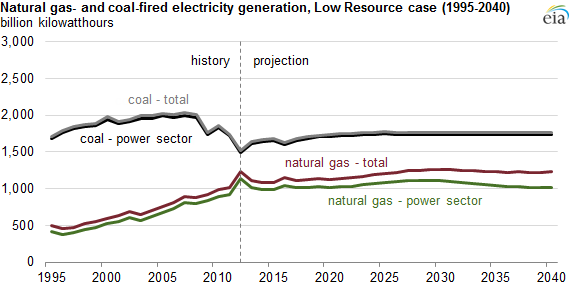
Note: The electric power sector comprises electricity-only plants and combined-heat-and-power plants whose primary business is to sell electricity, or electricity and heat, to the public. The difference between power sector generation and total generation equals end-use sector generation. All generation values are for net generation.
In the Low Resource case, natural gas production grows by an average of 0.6% per year from 2012 to 2040, when it totals 28 Tcf, 25% lower than in the Reference case. The Low Resource case projects that shale gas production peaks at 13 Tcf in 2030, whereas the Reference and High Resource cases project continued shale gas production growth through 2040.
As in the High Resource case, the Low Resource case does not project significantly different growth in natural gas-fired generation in the end-use sector, but differs greatly from the Reference case in terms of its projection of growth in the electric power sector:
- The Low Resource case projects that natural gas-fired generation in the power sector decreases by an annual average rate of 0.4%, as less new gas-fired capacity is added, and generation from existing gas plants declines later in the projection period.
- The delivered price of natural gas to the electric power sector surpasses $8.00/MMBtu in 2028, 12 years sooner than in the Reference case. By 2040, it reaches $10.82/MMBtu, 33% higher than in the Reference case.
- The higher natural gas prices in this case result in higher levels of nuclear and renewable capacity additions, which displace some of the older natural gas-fired generation. As a result, total natural gas-fired generation remains flat through 2040.
- Coal-fired generation in the power sector rises by an annual average of 0.5% and is almost double the level of natural-gas fired generation by 2040. Coal-fired retirements total 21 GW from 2015 to 2020, 24% lower than in the Reference case.
Principal contributors: Mike Ford, Laura Martin