Spot coal price trends vary across key basins during 2013
Republished January 16, 2014, 8:50 a.m., text was modified to clarify content.
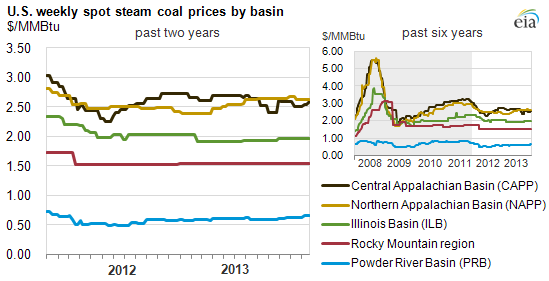
Spot steam coal price trends varied across key basins in 2013. Compared with 2012, while total coal demand increased, total coal supply decreased, yet regional differences in market fundamentals resulted in different spot price trends. Central Appalachian (CAPP) coal prices trended downwards, Northern Appalachian (NAPP) and Powder River Basin (PRB) coal prices trended upwards, and Illinois Basin (ILB) and Rocky Mountain coal prices remained largely unchanged.
Coal demand increased in 2013. Higher natural gas prices in 2013 resulted in the greater use of coal for electricity generation and higher domestic consumption of coal. This resulted in total coal consumption in all sectors in the first 11 months of 2013 of 35 million tons, or 4%, more than the same period of 2012. Meanwhile, total coal exports in the first nine months declined by nearly 8 million tons compared to the same period in 2012, following a few years of growth. Continued weakening in the European economy, slower demand growth in Asia, increased output from other coal-exporting countries, and lower international coal prices all contributed to the decrease in U.S. coal exports. International coal prices have increased since the third quarter of 2013 and supported an increase in exports toward the end of the year, which would reduce the drop between 2012 and 2013. Overall, the increase in domestic consumption more than offset the decline in exports, resulting in higher year-on-year total coal demand.
Coal supply decreased in 2013. Total coal production in 2013 was 4 million tons, or 0.4%, lower than in 2012, according to Mine Safety and Health Administration (MSHA) data through the first half of 2013 coupled with EIA estimates for second-half 2013. Coal imports in the first nine months of 2013 were largely on par with the same period of 2012 and are likely to remain unchanged year on year. As a result, overall supply of coal was less than in 2012.
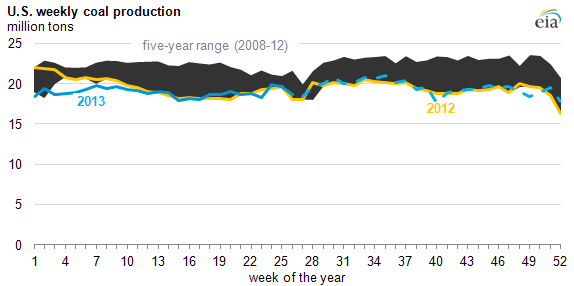
Note: Data for January 2008 through June 2013 were revised to match the MSHA data. Data for July 2013 through December 2013 are preliminary EIA estimates.
Coal stockpiles fell in 2013. Coal inventories in the electric power sector dropped by 31 million tons from the end of 2012 to 154 million tons at the end of September 2013. The significant drawdown reduced the stockpile to below the monthly five-year average and met the increased demand for electricity generation. Subbituminous coal, mostly from the Powder River Basin, was burned from stockpiles at a greater rate than bituminous coal (18 million and 14 million tons, respectively). Because the daily consumption of bituminous coal was lower than subbituminous coal in the power sector, the remaining stockpiles supported fewer days of burn for subbituminous coal than for bituminous coal, implying greater demand for delivery of PRB coal.
Mixed fundamentals across coal supply regions drove different price trajectories. While the supply-demand balance tightened for coal in general, changes in consumption and production of coal from different mining regions varied.
- On the demand side, the natural gas price at Henry Hub was between $3.50 per million British thermal units (MMBtu) and $4/MMBtu for most of 2013, making it more economic to burn PRB and ILB coals and many NAPP coals than it was in 2012, when gas prices stayed below $3/MMBtu for much of the year. CAPP coal remained mostly uneconomic at the 2013 gas price levels and continued losing market share as users accelerated efforts to shift to ILB and NAPP coals for their lower prices, supported by the installation of additional scrubbers for sulfur dioxide (SO2) emission control. These factors meant stronger demand growth of PRB, ILB, and NAPP coals and less demand growth for CAPP coal.
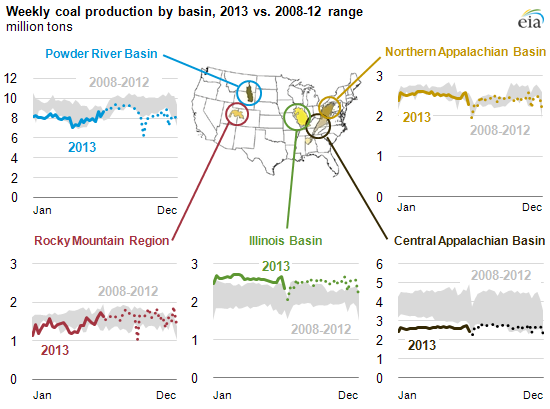
- On the supply side, CAPP coal production declined by 10 million tons, or 7%, year on year in response to weak demand. PRB coal production declined by 8 million tons, or 2%, year on year as a result of production curtailment to support prices and weather-related disruptions in mining and shipping. ILB, NAPP, and Rocky Mountain coal production all increased, with ILB coal growing the most (6 million tons, or 5%).
- In contrast to coal from other basins, NAPP prices recovered from a low in 2012 while PRB prices rose. The increase in the NAPP coal price was mainly the result of operation- and safety-related disruptions in production at large mines at a time of demand recovery. The higher PRB prices resulted from a tighter supply-demand balance. CAPP coal prices trended downward in the second half of 2013, reflecting the closure of higher-cost mines in the region, lower export prices, and stiff competition from other supply regions in the power market. ILB coal prices remained largely flat after a drop in early 2013 as producers expanded production to capture growing market share in both domestic and export markets.
Note: Data for January 2008 through June 2013 were revised to match the MSHA data. Data for July 2013 through December 2013 are preliminary EIA estimates.
Principal contributor: Ayaka Jones