Heating costs for most households are forecast to rise from last winter’s level
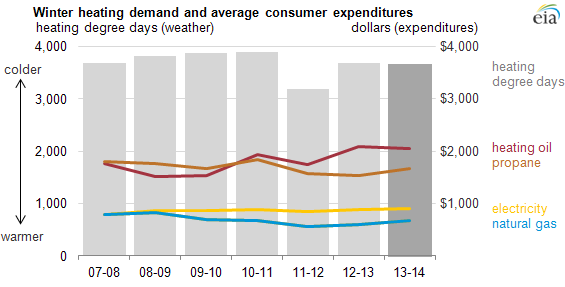
Note: Data for the winter of 2013-14 are the most recent forecasts. Propane data are the weighted averages of the Midwest and Northeast regional prices and consumption.
Republished October 8, 2013, 1:15 p.m. to clarify text and add a link.
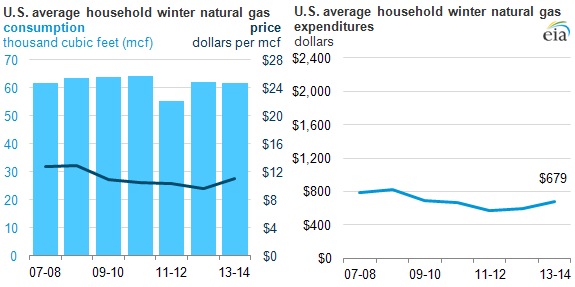
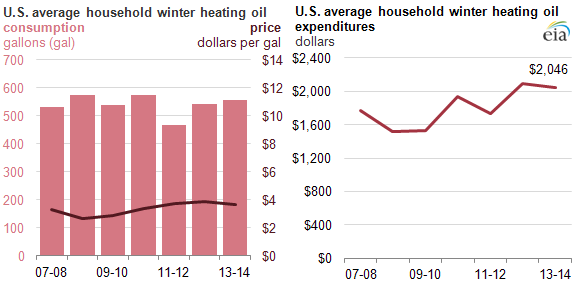
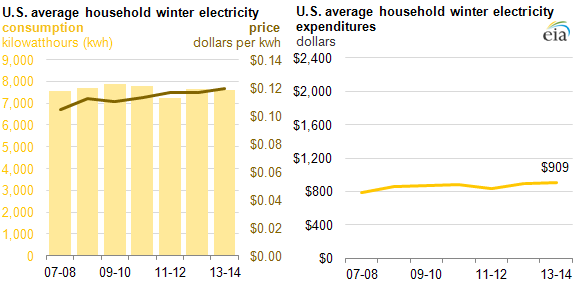
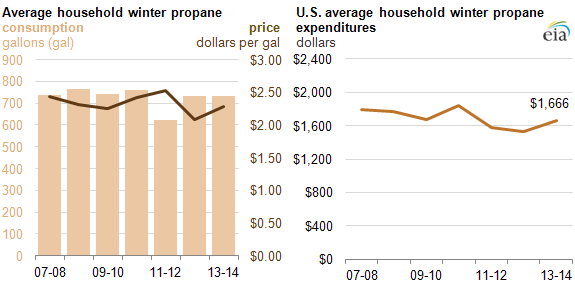
More than 90% of the 116 million homes in the United States are expected to have higher heating expenditures this winter (October 1, 2013-March 31, 2014) compared with last winter, mainly because of higher projected prices for residential natural gas, propane, and electricity, according to the U.S. Energy Information Administration's Short-Term Energy and Winter Fuels Outlook. EIA projects that average household expenditures for homes heating with natural gas will total $679 this winter, a 13% increase over last winter's average but 4% below the average of the five previous winters (October 2007-March 2012) (see chart above). Homes heating primarily with propane are expected to spend an average of $1,666 (9% more than last winter), while homes with electric heat are expected to spend $909 (2% more), and homes using heating oil are expected to spend $2,046 (2% less).
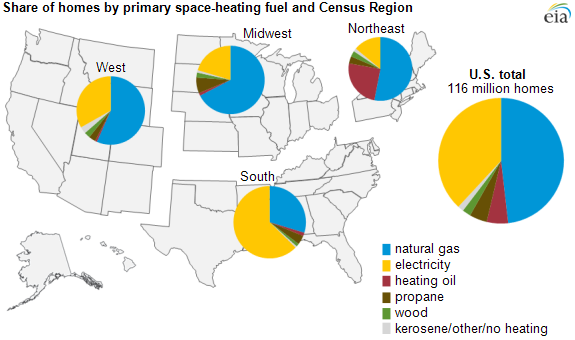
Changes in energy prices explain most of the differences in expected heating expenditures compared to last winter. Forecast temperatures are close to those recorded last winter nationally, but average temperatures and heating requirements vary in different areas of the country, with the Northeast expected to be about 3% colder and the West expected to be about 3% warmer than last winter. Additionally, the type of fuel used varies considerably by region (see map below), resulting in regional differences in total expenditures.
Details of the winter outlook for individual fuels are discussed below:
Source: U.S. Energy Information Administration Short-Term Energy Outlook, October 2013
Note: Winter covers the period October 1 through March 31.
According to the U.S. Census Bureau's 2012 American Community Survey, about one-half of U.S. households use natural gas as their primary heating fuel (see map). EIA expects households heating with natural gas to spend an average of $80 (13%) more this winter than last winter. The increase in natural gas expenditures represents a 14% increase in the average U.S. residential price from last winter. Fuel consumption is expected to be slightly lower than last winter nationally. The projected changes in residential natural gas prices this winter range from a 10% increase in the West to a 15% increase in the Northeast. A number of factors cause this regional variation, including differences in weather patterns, regional changes in production and pipeline capacity, and differences in regulatory constraints in passing price changes through to customers.
Source: U.S. Energy Information Administration Short-Term Energy Outlook, October 2013
Note: Winter covers the period October 1 through March 31.
EIA expects households heating primarily with heating oil to spend an average of about $46 (2%) less this winter than last winter, reflecting a 5% decrease in prices and a 3% increase in consumption. Although winter temperatures are expected to be similar to last winter nationally, weather in the Northeast is expected to be 3% colder than last winter. Reliance on heating oil is highest in the Northeast, where about 25% of households depend on heating oil for space heating, compared with 6% of households nationally. The state of New York, which accounts for about one-third of the region's heating oil market, has required the use of ultra-low sulfur heating fuel since July 2012. A number of other states will begin to move away from higher sulfur heating oil in the coming years.
Source: U.S. Energy Information Administration Short-Term Energy Outlook, October 2013
Note: Winter covers the period October 1 through March 31.
Households heating primarily with electricity can expect to spend an average of $18 (2%) more this winter with prices 2% higher but consumption slightly lower than last winter. About 39% of all U.S. households rely on electricity as their primary heating fuel, ranging from 14% of households in the Northeast to 63% in the South.
Source: U.S. Energy Information Administration Short-Term Energy Outlook, October 2013
Note: Propane use shown is a weighted average of the Northeast and Midwest regions on the United States—the major regions that use propane for space heating.
Note: Winter covers the period October 1 through March 31.
About 5% of all U.S. households heat with propane. EIA expects households heating primarily with propane to spend more this winter, but the projected increase varies across regions. EIA expects that households heating with propane in the Midwest will spend an average of $120 (9%) more this winter than last winter, reflecting prices that are about 10% higher and consumption that is 1% lower than last winter. Households in the Northeast are expected to spend an average of $206 (11%) more this winter, with average prices that are about 8% higher and consumption 3% higher than last year.
Nearly 2.5 million households (2%) used wood as their primary residential space heating fuel in 2012, which represents a 39% increase since 2004. About 8% of households use wood as a secondary source of heat, making wood second only to electricity as a supplemental heating fuel.
About 20% of New England homes (1.1 million) used wood for space heating, water heating, or cooking in 2009 (EIA, Residential Energy Consumption Survey, 2009), which is nearly twice the national rate. Almost half of all rural households in New England used wood compared with only 12% of the area's urban households that used the fuel. Unlike the other home heating fuels, there are no readily available sources for estimating wood consumption or prices at the regional or national level.
Principal contributor: Stacy MacIntyre