U.S. Energy Information Administration logo
Skip to sub-navigation
‹ Analysis & Projections

Annual Energy Outlook 2019

Release date: January 24, 2019   |  Next release date:  January 2020   |  full report

Correction/Update


2/1/2017

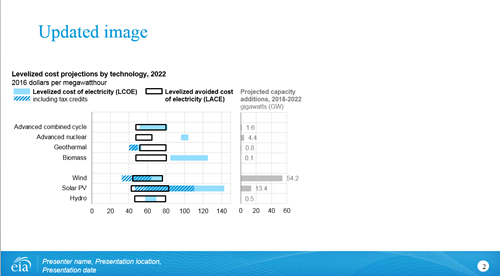
  • Updated LCOE values have resulted in 2 values in the original figure published in AEO2017 as incorrect
  • Max LCOE - advanced combined cycle

- Original: 76.7
- Updated: 81.7

  • Max LCOE - biomass

- Original: 128.6
- Updated: 125.3

U.S. Energy Information Administration - EIA - Independent Statistics and Analysis

Data

Reference case tables  
A1 Table 1. Total Energy Supply, Disposition, and Price Summary
A2 Table 2. Energy Consumption by Sector and Source
A3 Table 3. Energy Prices by Sector and Source
A4 Table 4. Residential Sector Key Indicators and Consumption
A5 Table 5. Commercial Sector Indicators and Consumption
A6 Table 6. Industrial Sector Key Indicators and Consumption
A7 Table 7. Transportation Sector Key Indicators and Delivered Energy Consumption
A8 Table 8. Electricity Supply, Disposition, Prices, and Emissions
A9 Table 9. Electricity Generating Capacity
A10 Table 10. Electricity Trade

Appendix tables ›

View all reference case tables ›

View all side case tables ›


Interactive Table ViewerInteractive Table Viewer ›
Provides custom data views of all AEO2019 cases. All available cases can be charted and the data for them downloaded.