This Week in Petroleum
Release Date: May 21, 2025
Next Release Date: May 29, 2025
-
Retail prices (dollars per gallon)
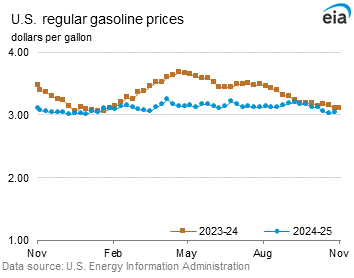
| Retail prices | Change from last | ||
|---|---|---|---|
| Gasoline | 05/19/25 | Week | Year |
| Click to chart this seriesU.S. | 3.173 | 0.053up-arrow | -0.411down-arrow |
| Click to chart this seriesEast Coast | 2.990 | 0.043up-arrow | -0.485down-arrow |
| Click to chart this seriesMidwest | 3.027 | 0.049up-arrow | -0.405down-arrow |
| Click to chart this seriesGulf Coast | 2.786 | 0.094up-arrow | -0.327down-arrow |
| Click to chart this seriesRocky Mountain | 3.131 | -0.006down-arrow | -0.299down-arrow |
| Click to chart this seriesWest Coast | 4.287 | 0.063up-arrow | -0.337down-arrow |
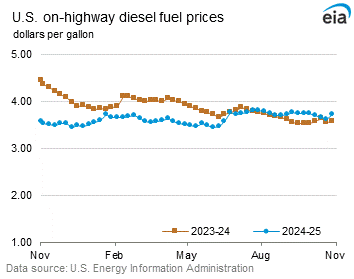
| Retail prices | Change from last | ||
|---|---|---|---|
| Diesel | 05/19/25 | Week | Year |
| Click to chart this seriesU.S. | 3.536 | 0.060up-arrow | -0.253down-arrow |
| Click to chart this seriesEast Coast | 3.580 | 0.046up-arrow | -0.315down-arrow |
| Click to chart this seriesMidwest | 3.481 | 0.065up-arrow | -0.204down-arrow |
| Click to chart this seriesGulf Coast | 3.201 | 0.058up-arrow | -0.289down-arrow |
| Click to chart this seriesRocky Mountain | 3.512 | 0.049up-arrow | -0.234down-arrow |
| Click to chart this seriesWest Coast | 4.296 | 0.085up-arrow | -0.199down-arrow |
-
Stocks (million barrels)
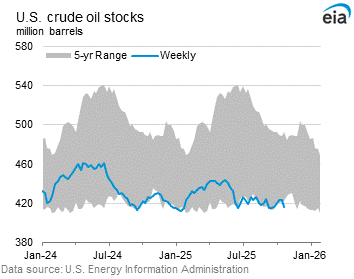
| Stocks | Change from last | ||
|---|---|---|---|
| 05/16/25 | Week | Year | |
| Click to chart this seriesCrude oil | 443.2 | 1.3up-arrow | -15.7down-arrow |
| Click to chart this seriesGasoline | 225.5 | 0.8up-arrow | -1.3down-arrow |
| Click to chart this seriesDistillate | 104.1 | 0.6up-arrow | -12.6down-arrow |
| Click to chart this seriesPropane | 53.099 | 2.674up-arrow | -11.116down-arrow |