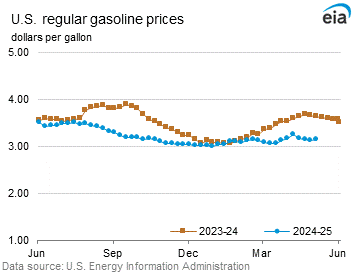
Retail prices (dollars per gallon)
| U.S. |
3.668 |
0.040up |
0.012up |
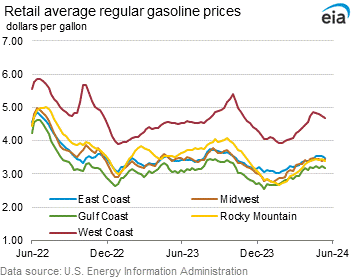
| East Coast |
3.540 |
0.089up-arrow |
-0.003down-arrow |
| Midwest |
3.463 |
-0.002down-arrow |
-0.089down-arrow |
| Gulf Coast |
3.232 |
0.055up-arrow |
-0.023down-arrow |
| Rocky Mountain |
3.456 |
0.028up-arrow |
-0.091down-arrow |
| West Coast |
4.832 |
-0.021down-arrow |
0.284up-arrow |
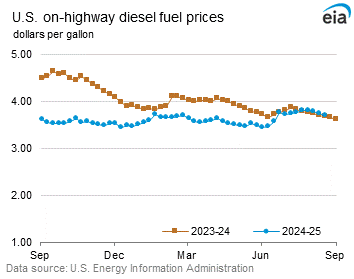
| U.S. |
3.992 |
-0.023down-arrow |
-0.085down-arrow |
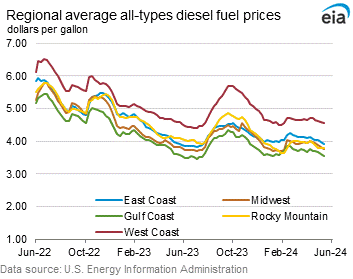
| East Coast |
4.047 |
-0.021down-arrow |
-0.104down-arrow |
| Midwest |
3.935 |
-0.030down-arrow |
-0.049down-arrow |
| Gulf Coast |
3.707 |
-0.003down-arrow |
-0.116down-arrow |
| Rocky Mountain |
3.883 |
-0.073down-arrow |
-0.241down-arrow |
| West Coast |
4.661 |
-0.041down-arrow |
-0.031down-arrow |
Futures prices (dollars per gallon*)
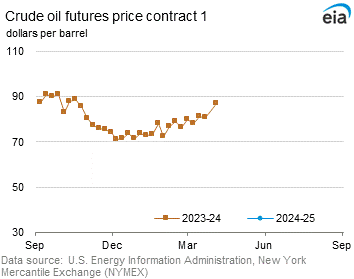
| Crude oil |
NA |
NAno_change |
NAno_change |
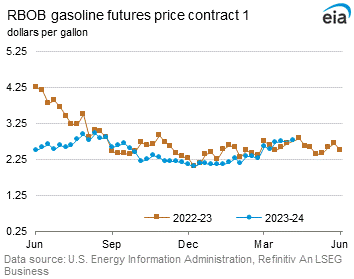
| Gasoline |
NA |
NAno_change |
NAno_change |
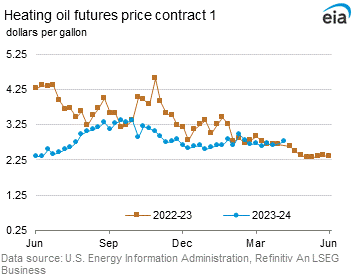
| Heating oil |
NA |
NAno_change |
NAno_change |
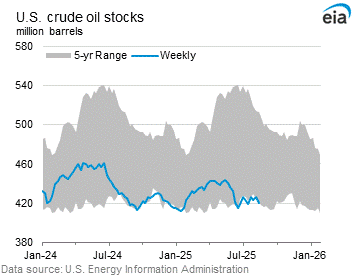
Stocks (million barrels)
| Crude oil |
453.6 |
-6.4down |
-7.3down |
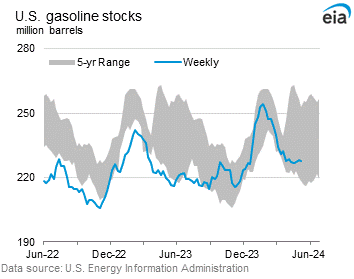
| Gasoline |
226.7 |
-0.6down |
5.6up |
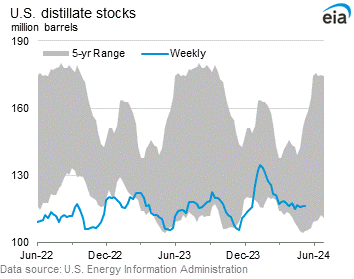
| Distillate |
116.6 |
1.6up |
5.1up |
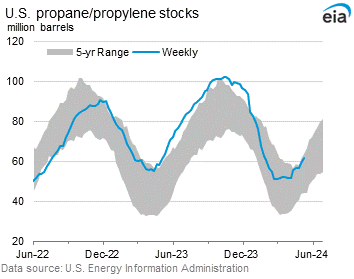
| Propane |
56.675 |
0.981up |
-2.214down |