This Week in Petroleum
Release Date: June 11, 2025
Next Release Date: June 18, 2025
-
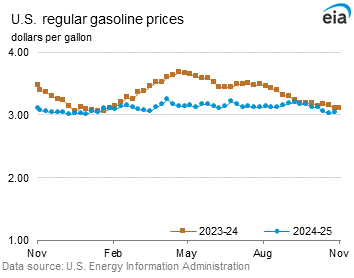
Retail prices (dollars per gallon)
| Retail prices | Change from last | ||
|---|---|---|---|
| Gasoline | 06/09/25 | Week | Year |
| Click to chart this seriesU.S. | 3.108 | -0.019down-arrow | -0.321down-arrow |
| Click to chart this seriesEast Coast | 2.949 | -0.027down-arrow | -0.421down-arrow |
| Click to chart this seriesMidwest | 2.966 | -0.001down-arrow | -0.296down-arrow |
| Click to chart this seriesGulf Coast | 2.716 | 0.014up-arrow | -0.235down-arrow |
| Click to chart this seriesRocky Mountain | 3.085 | -0.055down-arrow | -0.178down-arrow |
| Click to chart this seriesWest Coast | 4.154 | -0.053down-arrow | -0.217down-arrow |
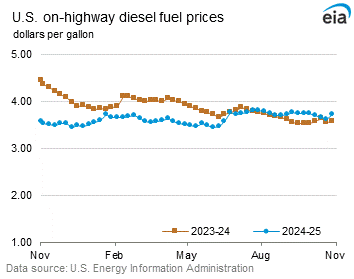
| Retail prices | Change from last | ||
|---|---|---|---|
| Diesel | 06/09/25 | Week | Year |
| Click to chart this seriesU.S. | 3.471 | 0.020up-arrow | -0.187down-arrow |
| Click to chart this seriesEast Coast | 3.525 | 0.008up-arrow | -0.264down-arrow |
| Click to chart this seriesMidwest | 3.429 | 0.041up-arrow | -0.083down-arrow |
| Click to chart this seriesGulf Coast | 3.109 | 0.012up-arrow | -0.275down-arrow |
| Click to chart this seriesRocky Mountain | 3.481 | 0.028up-arrow | -0.162down-arrow |
| Click to chart this seriesWest Coast | 4.217 | -0.004down-arrow | -0.160down-arrow |
-
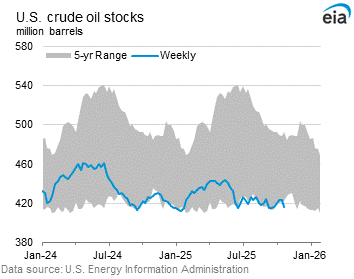
Stocks (million barrels)
| Stocks | Change from last | ||
|---|---|---|---|
| 06/06/25 | Week | Year | |
| Click to chart this seriesCrude oil | 432.4 | -3.6down-arrow | -27.2down-arrow |
| Click to chart this seriesGasoline | 229.8 | 1.5up-arrow | -3.7down-arrow |
| Click to chart this seriesDistillate | 108.9 | 1.2up-arrow | -14.5down-arrow |
| Click to chart this seriesPropane | 65.986 | 4.042up-arrow | -3.822down-arrow |