In the News:
EIA forecasts resilient, growing ethane production through 2021
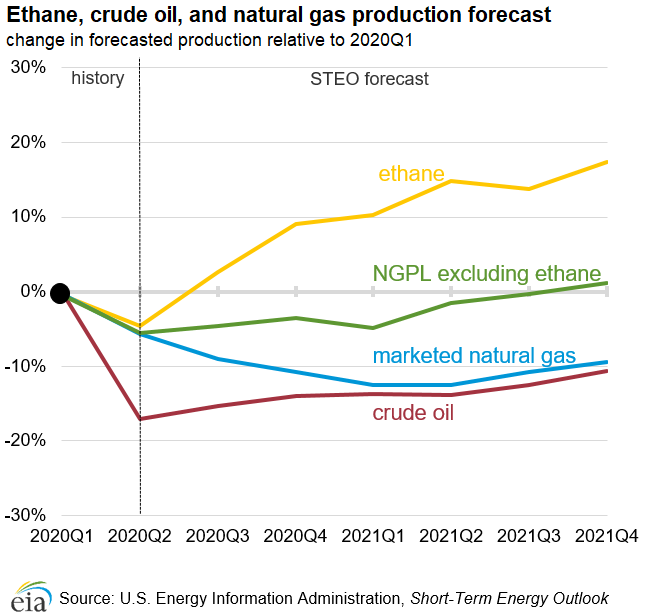
EIA’s August Short-Term Energy Outlook (STEO) calls for continuing growth in ethane production to satisfy growing demand, including demand from three new U.S. petrochemical plants that started up in the first half of 2020 and use ethane as feedstock. EIA forecasts ethane production will exceed 2 million b/d by the last quarter of 2020—nearly 9% higher than the 1.92 million b/d reported for the first quarter of 2020. Ethane production will continue to grow through 2021, reaching nearly 2.27 million b/d by the last quarter of 2021—18% higher than in the first quarter of 2020.
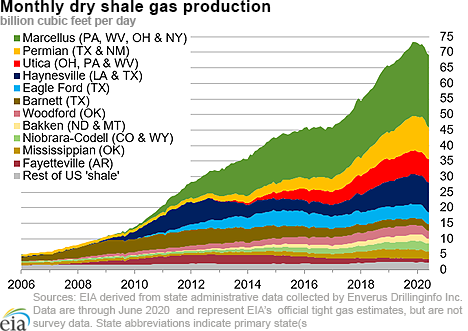
In contrast, EIA forecasts U.S. crude oil and marketed natural gas production to decline by close to 10% from the first quarter of 2020 to the last quarter of 2021. EIA expects that crude oil production will remain lower than the average 12.75 million b/d achieved in the first quarter of 2020 throughout the forecast period, recovering to a peak of 11.40 million b/d by the last quarter of 2021. EIA forecasts that natural gas production will also remain lower than the 98.3 billion cubic feet per day (Bcf/d) production level reached in the first quarter of 2020, and final quarter 2021 production is forecast at 89.3 Bcf/d.
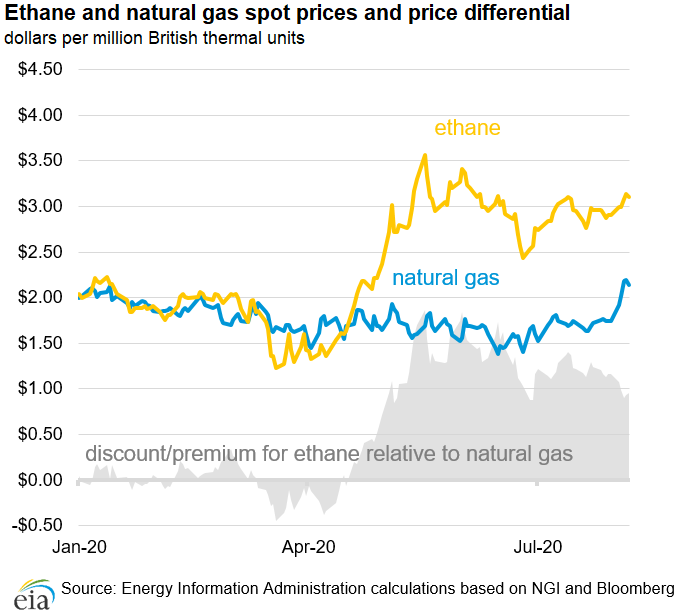
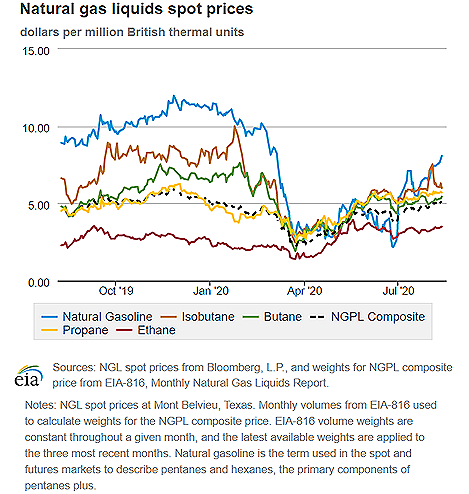
Ethane is separated from natural gas at natural gas processing plants along with other natural gas plant liquids (NGPL) (propane, normal butane, isobutane, and natural gasoline). However, not all ethane is recovered. Ethane can be left in the natural gas stream, a process known as ethane rejection, to be sold along with natural gas instead of being separated at natural gas processing plants. The decision to recover ethane at natural gas processing plants is based primarily on the price of ethane relative to natural gas on a heating-value equivalent basis.
After the prices of NGPLs collapsed with crude oil in March 2020, prices have started recovering, especially ethane, which is one of the few petroleum products that had a higher average price in July than in January. Strong domestic and international petrochemical demand for U.S. ethane has resulted in ethane prices remaining higher than natural gas prices on a heating content equivalent basis since the second half of April. This price signal, a persistent $1.00 premium to natural gas, has given natural gas processing plant operators an incentive to recover more ethane from the raw natural gas stream and ship that ethane to the Gulf Coast for consumption or export.
Overview:
(For the week ending Wednesday, August 12, 2020)
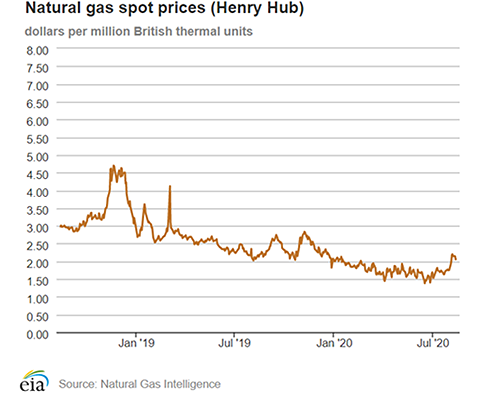
- Natural gas spot price movements were mixed this report week (Wednesday, August 5 to Wednesday, August 12). The Henry Hub spot price fell from $2.18 per million British thermal units (MMBtu) last Wednesday to $2.06/MMBtu yesterday.
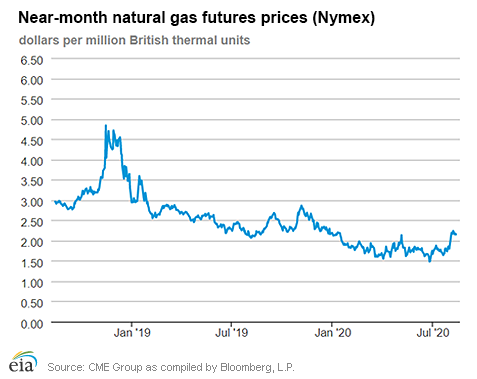
- At the New York Mercantile Exchange (Nymex), the price of the September 2020 contract decreased 4¢, from $2.191/MMBtu last Wednesday to $2.152/MMBtu yesterday. The price of the 12-month strip averaging September 2020 through August 2021 futures contracts remained the same Wednesday to Wednesday at $2.717/MMBtu.
- The net injections to working gas totaled 58 billion cubic feet (Bcf) for the week ending August 7. Working natural gas stocks totaled 3,332 Bcf, which is 22% more than the year-ago level and 15% more than the five-year (2015–19) average for this week.
- The natural gas plant liquids composite price at Mont Belvieu, Texas, rose by 14¢/MMBtu, averaging $5.05/MMBtu for the week ending August 12. The price of isobutane fell by 9%. The prices of natural gasoline, ethane, butane, and propane rose by 9%, 5%, 5%, and 2%, respectively.
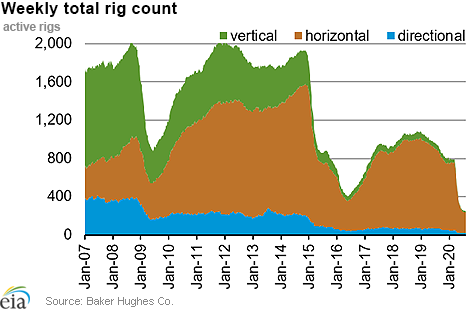
- According to Baker Hughes, for the week ending Tuesday, August 4, the natural gas rig count remained flat at 69. The number of oil-directed rigs fell by 4 to 176. The total rig count decreased by 4, and it now stands at 247.
Prices/Supply/Demand:
Prices are mixed amid seasonal temperatures. This report week (Wednesday, August 5 to Wednesday, August 12), the Henry Hub spot price fell 12¢ from $2.18/MMBtu last Wednesday to a low of $2.06/MMBtu yesterday. Temperatures across the Lower 48 states were relatively close to normal but a bit cooler than normal on the West Coast. At the Chicago Citygate, the price decreased 3¢ from $1.95/MMBtu last Wednesday to $1.92/MMBtu yesterday.
California prices end week at highs. The price at SoCal Citygate in Southern California increased 83¢ from $2.20/MMBtu last Wednesday to a high of $3.03/MMBtu yesterday. Amid cooler-than-normal temperatures, the region posted net injections into working underground storage every day during the report week except for Monday. The cooler-than-normal temperatures, which failed to exceed 80 degrees Fahrenheit on some days, limited power demand as SoCal Citygate prices fell to as low as $1.93/MMBtu. The price at PG&E Citygate in Northern California rose 10¢, up from $2.73/MMBtu last Wednesday to a high of $2.83/MMBtu yesterday. California prices are up at the end of the report week with forecasts of warmer-than-normal temperatures in the coming report week.
Northeast prices are up. At the Algonquin Citygate, which serves Boston-area consumers, the price went up 11¢ from $1.57/MMBtu last Wednesday to $1.68/MMBtu yesterday amid warmer-than-normal temperatures in the Boston region. At the Transcontinental Pipeline Zone 6 trading point for New York City, the price increased 14¢ from $1.57/MMBtu last Wednesday to $1.71/MMBtu yesterday.
The Tennessee Zone 4 Marcellus spot price decreased 14¢ from $1.30/MMBtu last Wednesday to $1.16/MMBtu yesterday. The price at Dominion South in southwest Pennsylvania fell 26¢ from $1.42/MMBtu last Wednesday to $1.16/MMBtu yesterday.
Permian Basin prices end week on a high, narrowing the basis to the Henry Hub. The price at the Waha Hub in West Texas, which is located near Permian Basin production activities, averaged $1.13/MMBtu last Wednesday, $1.05/MMBtu lower than the Henry Hub price. Yesterday, the price at the Waha Hub averaged a high of $1.61/MMBtu, 45¢/MMBtu lower than the Henry Hub price, as Henry Hub prices end the week on a low. According to Natural Gas Intelligence, the higher price at the Waha Hub was likely because of the completion of pipeline maintenance, which improved flows out of the region.
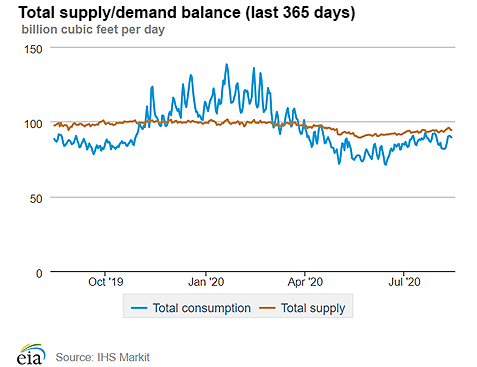
Supply rises. According to data from IHS Markit, the average total supply of natural gas rose by 1.3% compared with the previous report week. Dry natural gas production grew by 1.2% compared with the previous report week. Average net imports from Canada increased by 2.6% from last week.
Demand rises slightly with gains in the power sector and LNG feedgas. Total U.S. consumption of natural gas rose by 0.5% compared with the previous report week, according to data from IHS Markit. Feedgas to liquefied natural gas (LNG) terminals were the largest contributor to rising consumption this week, increasing 14% and rising from an average of 3.8 Bcf last week to 4.4 Bcf this week. Natural gas consumed for power generation climbed by 0.9% week over week. In the residential and commercial sectors, consumption increased by 1.9%. Industrial sector consumption decreased by 0.7% week over week. Natural gas exports to Mexico decreased 1.7%.
U.S. LNG exports increase week over week. Eight LNG vessels (three from Cameron, two from Cove Point, and one each from Sabine Pass, Corpus Christi, and Freeport) with a combined LNG-carrying capacity of 29 Bcf departed the United States between August 6 and August 12, 2020, according to shipping data provided by Marine Traffic.
Storage:
The net injections into storage totaled 58 Bcf for the week ending August 7, compared with the five-year (2015–19) average net injections of 44 Bcf and last year's net injections of 51 Bcf during the same week. Working natural gas stocks totaled 3,332 Bcf, which is 443 Bcf more than the five-year average and 608 Bcf more than last year at this time.
According to The Desk survey of natural gas analysts, estimates of the weekly net change to working natural gas stocks ranged from net injections of 42 Bcf to 65 Bcf, with a median estimate of 56 Bcf.
The average rate of injections into storage is 11% higher than the five-year average so far in the refill season (April through October). Working gas stocks exceeded the 5-year max. If the rate of injections into storage matched the five-year average of 9.8 Bcf/d for the remainder of the refill season, the total inventory would be 4,166 Bcf on October 31, which is 443 Bcf higher than the five-year average of 3,723 Bcf for that time of year.
More storage data and analysis can be found on the Natural Gas Storage Dashboard and the Weekly Natural Gas Storage Report.
See also:
| Spot Prices ($/MMBtu) | Thu, 06-Aug |
Fri, 07-Aug |
Mon, 10-Aug |
Tue, 11-Aug |
Wed, 12-Aug |
|---|---|---|---|---|---|
| Henry Hub |
2.20 |
2.14 |
2.15 |
2.14 |
2.06 |
| New York |
1.35 |
1.40 |
1.96 |
1.96 |
1.71 |
| Chicago |
1.94 |
1.89 |
1.94 |
1.96 |
1.92 |
| Cal. Comp. Avg.* |
2.16 |
2.07 |
2.26 |
2.41 |
2.50 |
| Futures ($/MMBtu) | |||||
| September contract | 2.165 |
2.238 |
2.153 |
2.171 |
2.152 |
| October contract |
2.305 |
2.376 |
2.287 |
2.311 |
2.297 |
| *Avg. of NGI's reported prices for: Malin, PG&E Citygate, and Southern California Border Avg. | |||||
| Source: NGI's Daily Gas Price Index | |||||
| U.S. natural gas supply - Gas Week: (8/6/20 - 8/12/20) | |||
|---|---|---|---|
Average daily values (Bcf/d): |
|||
this week |
last week |
last year |
|
| Marketed production | 101.3 |
100.0 |
104.8 |
| Dry production | 89.6 |
88.6 |
92.3 |
| Net Canada imports | 4.9 |
4.8 |
4.5 |
| LNG pipeline deliveries | 0.2 |
0.1 |
0.1 |
| Total supply | 94.7 |
93.5 |
96.8 |
|
Source: IHS Markit | |||
| U.S. natural gas consumption - Gas Week: (8/6/20 - 8/12/20) | |||
|---|---|---|---|
Average daily values (Bcf/d): |
|||
this week |
last week |
last year |
|
| U.S. consumption | 69.4 |
69.0 |
71.8 |
| Power | 40.5 |
40.1 |
42.9 |
| Industrial | 20.5 |
20.7 |
20.9 |
| Residential/commercial | 8.4 |
8.2 |
8.0 |
| Mexico exports | 5.6 |
5.7 |
5.4 |
| Pipeline fuel use/losses | 6.8 |
6.8 |
6.5 |
| LNG pipeline receipts | 4.4 |
3.8 |
4.0 |
| Total demand | 86.2 |
85.3 |
87.7 |
|
Source: IHS Markit | |||
| Rigs | |||
|---|---|---|---|
Tue, August 04, 2020 |
Change from |
||
last week |
last year |
||
| Oil rigs | 176 |
-2.2% |
-77.0% |
| Natural gas rigs | 69 |
0.0% |
-59.2% |
| Note: Excludes any miscellaneous rigs | |||
| Rig numbers by type | |||
|---|---|---|---|
Tue, August 04, 2020 |
Change from |
||
last week |
last year |
||
| Vertical | 12 |
-7.7% |
-76.9% |
| Horizontal | 211 |
-2.3% |
-74.2% |
| Directional | 24 |
9.1% |
-63.1% |
| Source: Baker Hughes Co. | |||
| Working gas in underground storage | ||||
|---|---|---|---|---|
Stocks billion cubic feet (Bcf) |
||||
| Region | 2020-08-07 |
2020-07-31 |
change |
|
| East | 738 |
718 |
20 |
|
| Midwest | 856 |
830 |
26 |
|
| Mountain | 206 |
202 |
4 |
|
| Pacific | 314 |
311 |
3 |
|
| South Central | 1,219 |
1,214 |
5 |
|
| Total | 3,332 |
3,274 |
58 |
|
|
Source: Form EIA-912, Weekly Underground Natural Gas Storage Report | ||||
| Working gas in underground storage | |||||
|---|---|---|---|---|---|
Historical comparisons |
|||||
Year ago (8/7/19) |
5-year average (2015-2019) |
||||
| Region | Stocks (Bcf) |
% change |
Stocks (Bcf) |
% change |
|
| East | 628 |
17.5 |
666 |
10.8 |
|
| Midwest | 721 |
18.7 |
732 |
16.9 |
|
| Mountain | 163 |
26.4 |
181 |
13.8 |
|
| Pacific | 272 |
15.4 |
292 |
7.5 |
|
| South Central | 940 |
29.7 |
1,018 |
19.7 |
|
| Total | 2,724 |
22.3 |
2,889 |
15.3 |
|
| Source: Form EIA-912, Weekly Underground Natural Gas Storage Report | |||||
| Temperature – heating & cooling degree days (week ending Aug 06) | ||||||||
|---|---|---|---|---|---|---|---|---|
HDD deviation from: |
CDD deviation from: |
|||||||
| Region | HDD Current |
normal |
last year |
CDD Current |
normal |
last year |
||
| New England | 0 |
-2 |
-1 |
70 |
26 |
24 |
||
| Middle Atlantic | 0 |
-3 |
0 |
70 |
12 |
3 |
||
| E N Central | 9 |
4 |
8 |
26 |
-30 |
-28 |
||
| W N Central | 9 |
6 |
9 |
32 |
-37 |
-34 |
||
| South Atlantic | 0 |
0 |
0 |
108 |
12 |
8 |
||
| E S Central | 0 |
0 |
0 |
84 |
-10 |
-9 |
||
| W S Central | 0 |
0 |
0 |
115 |
-10 |
-19 |
||
| Mountain | 0 |
-2 |
0 |
96 |
21 |
-4 |
||
| Pacific | 0 |
-2 |
0 |
55 |
8 |
-13 |
||
| United States | 3 |
1 |
3 |
72 |
-1 |
-9 |
||
|
Note: HDD = heating degree day; CDD = cooling degree day Source: National Oceanic and Atmospheric Administration | ||||||||
Average temperature (°F)
7-day mean ending Aug 06, 2020
Source: National Oceanic and Atmospheric Administration
Deviation between average and normal (°F)
7-day mean ending Aug 06, 2020
Source: National Oceanic and Atmospheric Administration