In the News:
Woodfibre LNG becomes the first Canadian LNG project to receive Final Investment Decision
Earlier this month, Woodfibre LNG became the first Canadian liquefied natural gas (LNG) project to receive a Final Investment Decision (FID) to build an LNG export facility. The Woodfibre LNG terminal will be located on the north side of Howe Sound, near Squamish, British Columbia, 30 miles north of Vancouver. The project sponsor, Pacific Oil and Gas, a wholly-owned subsidiary of Singapore-based Royal Golden Eagle, expects to begin construction in 2017 and start LNG exports in 2020.
Woodfibre LNG is a relatively small project (0.3 billion cubic feet per day (Bcf/d)) compared with other liquefaction projects proposed in Western Canada. Unlike other proposed LNG export projects in Western Canada, Woodfibre LNG does not include upstream acreage in emerging unconventional plays. The project will be supplied by natural gas from the existing market hubs near Vancouver sourced from the Western Canadian Sedimentary Basin, and transported south via Spectra's British Columbia 2.9 Bcf/d mainline, connected to the FortisBC pipeline grid.
Woodfibre LNG has secured a 25-year export license from the Canadian National Energy Board (NEB) and environmental permits from the British Columbia (BC) Environmental Assessment Office and the Canadian Environmental Assessment Agency. The project still needs permits from British Columbia's Oil and Gas Commission and the District of Squamish. In line with BC's Climate Leadership Plan Initiative, this facility will use only electricity (not natural gas) for its operational fuel needs, most of which will be sourced from hydropower.
The Woodfibre LNG project sponsors have signed two preliminary non-binding offtake supply agreements so far—one with a Chinese natural gas distribution company, Guangzhou Gas Group, to supply 0.13 Bcf/d for 25 years starting in 2020, and another with Beijing Gas Group with undisclosed terms.
The small size and minimal infrastructure requirements of Woodfibre LNG may facilitate rapid development of the project. As of November 2016, 32 proposed liquefaction projects in Canada secured export licenses from the NEB, with several of these projects also obtaining federal and provincial environmental permits, but only Woodfibre LNG has reached an FID.
Overview:
(For the Week Ending Wednesday, November 16, 2016)
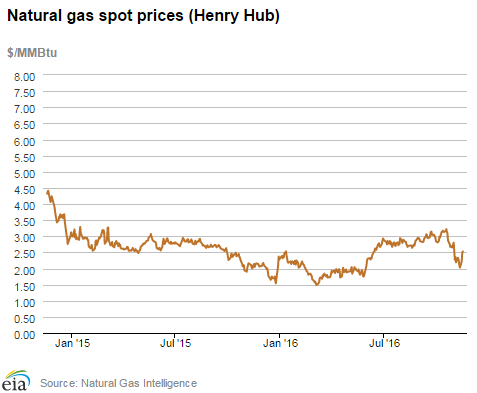
- Natural gas spot prices rose at most locations this report week (Wednesday, November 9 to Wednesday, November 16). The Henry Hub spot price rose from $2.22 per million British thermal units (MMBtu) last Wednesday to $2.53/MMBtu yesterday.
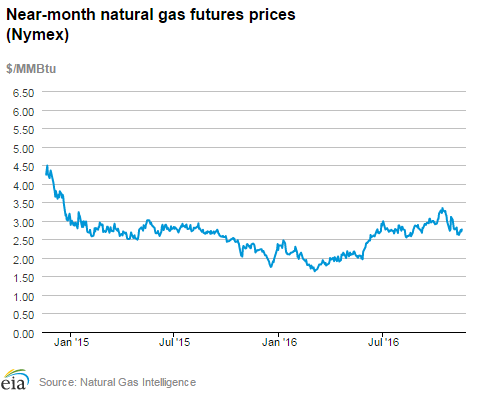
- At the New York Mercantile Exchange (Nymex), the December 2016 contract rose 7¢ from $2.690/MMBtu last Wednesday to $2.764/MMBtu yesterday.
- Net injections to working gas totaled 30 billion cubic feet (Bcf) for the week ending November 11. Working natural gas stocks are 4,047 Bcf, which is 1% greater than the year-ago level and 6% greater than the five-year (2011–15) average for this week.
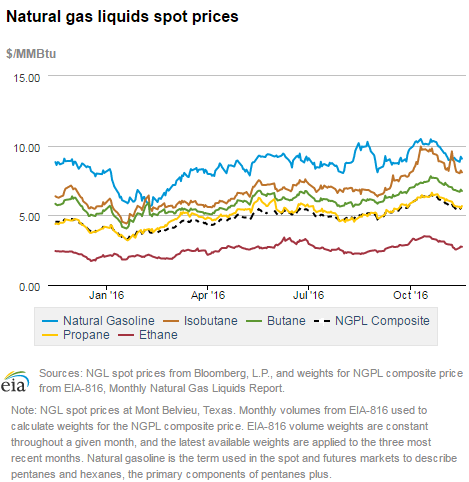
- The natural gas plant liquids composite price at Mont Belvieu, Texas, fell by 25¢, closing at $5.60/MMBtu for the week ending November 11. The prices of natural gasoline, ethane, propane, and butane fell by 3%, 11%, 6%, and 5%, respectively. The price of isobutane rose by 5%.
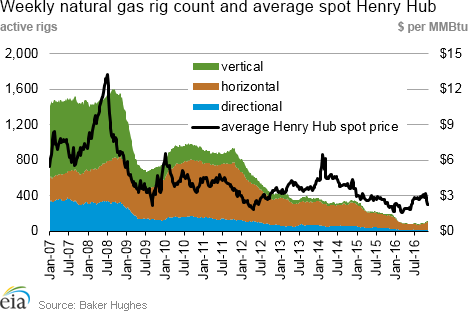
- According to Baker Hughes, for the week ending Friday, November 11, the natural gas rig count decreased by 2 to 115. The number of oil-directed rigs rose by 2 to 452. The number of miscellaneous rigs went down by 1 during the week. The total rig count dropped by 1, and it now stands at 568.
Prices/Supply/Demand:
Price movements up at most locations this week. This report week (Wednesday, November 9 to Wednesday, November 16), the Henry Hub spot price rose 31¢ from $2.22/MMBtu last Wednesday to $2.53/MMBtu yesterday. Average temperatures dropped virtually everywhere in the country this week, pushing up home heating demand and prices. At the Chicago Citygate, prices increased 27¢ from $2.15/MMBtu last Wednesday to $2.42/MMBtu yesterday. Prices on the West Coast moved similarly. At PG&E Citygate in Northern California, prices gained 40¢, up to $2.94/MMBtu yesterday. The price at SoCal Citygate rose 33¢ over the report week to $2.68/MMBtu yesterday.
Northeast prices up outside of Boston. At the Transcontinental Pipeline Zone 6 trading point for New York, prices increased 23¢ from $1.91/MMBtu last Wednesday to $2.14/MMBtu yesterday.
Tennessee Zone 4 Marcellus spot prices advanced 27¢ from $1.71/MMBtu last Wednesday to $1.98/MMBtu yesterday. Prices at Dominion South in northwest Pennsylvania rose 28¢ from $1.79/MMBtu last Wednesday to $2.07/MMBtu yesterday.
At the Algonquin Citygate, which serves Boston-area consumers, the price fell 55¢ from $2.80/MMBtu last Wednesday to $2.25/MMBtu yesterday. Immediately prior to the start of this report week, Algonquin climbed 66¢ to $2.80/MMBtu, but mostly stayed within the $2.20/MMBtu to $2.40/MMBtu range this report period. Algonquin typically experiences delivery constraints into Boston during the winter, resulting in high prices, but the Algonquin Incremental Market Project, which has been partially placed in service, may help alleviate supply constraints in the region.
Future prices up. At the Nymex, the price of the December 2016 contract increased 7¢, from $2.690/MMBtu last Wednesday to $2.764/MMBtu yesterday. The price of the 12-month strip averaging December 2016 through November 2017, futures contracts climbed 8¢ to $2.961/MMBtu.
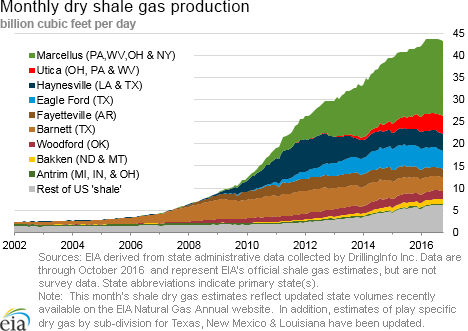
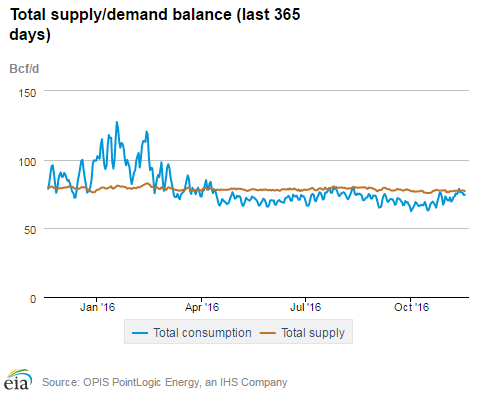
Supply remains flat. According to data from PointLogic, the average total supply of natural gas remained the same as the previous report week, averaging 77.4 Bcf/d. Dry natural gas production grew by 1% compared with the previous report week. Average net imports from Canada decreased by 4% from last week.
Demand up. Total U.S. consumption of natural gas rose by 6% compared with the previous report week, according to data from PointLogic. Power burn was flat, averaging 23.0 Bcf/d. Industrial sector consumption increased by 2% week over week. In the residential and commercial sectors, consumption increased by 18% as a result of increased demand for home heating. Natural gas exports to Mexico were the same as last week, averaging 3.8 Bcf/d.
U.S. LNG exports. Natural gas pipeline flows to Sabine Pass liquefaction terminal averaged 1.8 Bcf/d, 16% higher than flows last week. Three vessels (combined LNG-carrying capacity 11.1 Bcf) departed the terminal during last week, and one vessel (LNG-carrying capacity 3.4 Bcf) is currently loading at the terminal. Sabine Pass has exported six cargoes so far this month and 40 cargoes since the start of operations in February. With one more vessel currently loading at the terminal, the total number of cargoes exported so far in November will stand at 7, totaling approximately 24 Bcf. One more vessel is scheduled to arrive at the terminal in the next few days. With almost two weeks remaining in November, the export volumes are likely to continue to increase.
Storage:
Continued early heating season injections push working gas storage to record levels. Net injections into storage totaled 30 Bcf, compared with the five-year (2011–15) average net injection of 3 Bcf and last year's net injections of 26 Bcf during the same week. For the second week in a row, net injections into storage exceeded the five-year average. Unseasonably mild temperatures mitigated consumption of natural gas and contributed to considerably larger-than-average net injections. Working gas stocks total 4,047 Bcf, an all-time high, and are 216 Bcf higher than the five-year average and 51 Bcf higher than last year at this time.
Most regions in the Lower 48 states top record storage levels. Working gas stocks in the Midwest, Mountain, and South Central regions exceeded their previous five-year highs of 1,126 Bcf, 230 Bcf, and 1,363 Bcf, respectively. The East region posted its first withdrawal of the 2016–17 heating season (November 1–March 31), and stocks in the region were 16 Bcf below their five-year maximum of 960 Bcf set in 2012. The Pacific region is 58 Bcf below its five-year maximum, in large part because of inventory restrictions on the Aliso Canyon facility.
South Central region climbs past year-ago levels, robust injections continue at salt facilities. Net injections totaled 20 Bcf in the South Central region, with salt dome facilities accounting for net injections of 9 Bcf. Total net injections in the region topped the five-year average of 5 Bcf for the week. Since September 23, when net injections last fell below the five-year average at the salt dome facilities, net injections have totaled 119 Bcf, 61% above the five-year average. Working gas stocks in the South Central region are 10% higher than the five-year average for this time of year.
Net injections are in line with market expectations. Estimates of net injections into storage ranged from 24 Bcf to 41 Bcf, with a median of 30 Bcf. The price of the Nymex futures contract for December delivery at the Henry Hub fell 3¢/MMBtu to $2.71MMBtu in 270 trades at the release of EIA's Weekly Natural Gas Storage Report (WNGSR). Prices recovered somewhat in subsequent trading, averaging $2.72/MMBtu within two minutes of the release.
Spread to the January futures price remains higher than year-ago levels, increasing on the week. During the most recent storage week, the average natural gas spot price at the Henry Hub was $2.23/MMBtu, while the Nymex futures price of natural gas for delivery in January 2017 averaged $2.88/MMBtu, a difference of 65¢. The premium was 57¢/MMBtu during the previous storage week. The increase in the premium over the previous storage week resulted primarily from a decline in the spot price on the week because of the relatively light heating demand for natural gas. The premium was 39¢ a year ago.
Temperatures were lower than last week and remain higher than normal. Temperatures in the Lower 48 states averaged 55°F, 6°F higher than the normal and 2°F higher than last year at this time. Cooling degree days (CDD) in the Lower 48 states totaled 7, compared with 9 last year and compared with a normal of 5. Heating degree days (HDD) in the Lower 48 states totaled 76, compared with 92 last year and a normal of 118.
See also:

| Spot Prices ($/MMBtu) | Thu, 10-Nov |
Fri, 11-Nov |
Mon, 14-Nov |
Tue, 15-Nov |
Wed, 16-Nov |
|---|---|---|---|---|---|
| Henry Hub |
2.08 |
2.03 |
2.22 |
2.49 |
2.53 |
| New York |
2.00 |
2.06 |
2.10 |
2.15 |
2.14 |
| Chicago |
2.00 |
2.00 |
2.22 |
2.40 |
2.42 |
| Cal. Comp. Avg.* |
2.09 |
1.95 |
2.38 |
2.50 |
2.60 |
| Futures ($/MMBtu) | |||||
| December contract | 2.632 |
2.619 |
2.749 |
2.709 |
2.764 |
| January contract |
2.811 |
2.850 |
2.937 |
2.885 |
2.920 |
| *Avg. of NGI's reported prices for: Malin, PG&E Citygate, and Southern California Border Avg. | |||||
| Source: NGI's Daily Gas Price Index | |||||
| U.S. natural gas supply - Gas Week: (11/10/16 - 11/16/16) | |||
|---|---|---|---|
Average daily values (Bcf/d): |
|||
this week |
last week |
last year |
|
| Marketed production | 80.3 |
79.7 |
80.8 |
| Dry production | 72.1 |
71.6 |
72.9 |
| Net Canada imports | 5.0 |
5.2 |
5.8 |
| LNG pipeline deliveries | 0.2 |
0.2 |
0.2 |
| Total supply | 77.4 |
77.0 |
78.9 |
|
Source: OPIS PointLogic Energy, an IHS Company | |||
| U.S. natural gas consumption - Gas Week: (11/10/16 - 11/16/16) | |||
|---|---|---|---|
Average daily values (Bcf/d): |
|||
this week |
last week |
last year |
|
| U.S. consumption | 64.7 |
60.9 |
68.9 |
| Power | 23.0 |
22.9 |
24.2 |
| Industrial | 21.1 |
20.6 |
21.0 |
| Residential/commercial | 20.6 |
17.4 |
23.7 |
| Mexico exports | 3.8 |
3.8 |
3.0 |
| Pipeline fuel use/losses | 6.1 |
5.8 |
6.5 |
| LNG pipeline receipts | 1.5 |
1.5 |
0.0 |
| Total demand | 76.1 |
71.9 |
78.5 |
|
Source: OPIS PointLogic Energy, an IHS Company | |||
| Rigs | |||
|---|---|---|---|
Fri, November 11, 2016 |
Change from |
||
last week |
last year |
||
| Oil rigs | 452 |
0.4% |
-21.3% |
| Natural gas rigs | 115 |
-1.7% |
-40.4% |
| Miscellaneous | 1 |
-50.0% |
0.0% |
| Rig numbers by type | |||
|---|---|---|---|
Fri, November 11, 2016 |
Change from |
||
last week |
last year |
||
| Vertical | 59 |
1.7% |
-45.4% |
| Horizontal | 457 |
-0.4% |
-22.1% |
| Directional | 52 |
0.0% |
-27.8% |
| Source: Baker Hughes Inc. | |||
| Working gas in underground storage | ||||
|---|---|---|---|---|
Stocks billion cubic feet (Bcf) |
||||
| Region | 2016-11-11 |
2016-11-04 |
change |
|
| East | 944 |
946 |
-2 |
|
| Midwest | 1,155 |
1,148 |
7 |
|
| Mountain | 257 |
253 |
4 |
|
| Pacific | 328 |
327 |
1 |
|
| South Central | 1,363 |
1,343 |
20 |
|
| Total | 4,047 |
4,017 |
30 |
|
| Source: U.S. Energy Information Administration | ||||
| Working gas in underground storage | |||||
|---|---|---|---|---|---|
Historical comparisons |
|||||
Year ago (11/11/15) |
5-year average (2011-2015) |
||||
| Region | Stocks (Bcf) |
% change |
Stocks (Bcf) |
% change |
|
| East | 933 |
1.2 |
926 |
1.9 |
|
| Midwest | 1,122 |
2.9 |
1,093 |
5.7 |
|
| Mountain | 215 |
19.5 |
209 |
23.0 |
|
| Pacific | 381 |
-13.9 |
369 |
-11.1 |
|
| South Central | 1,345 |
1.3 |
1,234 |
10.5 |
|
| Total | 3,996 |
1.3 |
3,831 |
5.6 |
|
| Source: U.S. Energy Information Administration | |||||
| Temperature -- heating & cooling degree days (week ending Nov 10) | ||||||||
|---|---|---|---|---|---|---|---|---|
HDD deviation from: |
CDD deviation from: |
|||||||
| Region | HDD Current |
normal |
last year |
CDD Current |
normal |
last year |
||
| New England | 144 |
-1 |
45 |
0 |
0 |
0 |
||
| Middle Atlantic | 117 |
-19 |
32 |
0 |
0 |
0 |
||
| E N Central | 100 |
-53 |
-18 |
0 |
0 |
0 |
||
| W N Central | 88 |
-78 |
-31 |
0 |
0 |
0 |
||
| South Atlantic | 74 |
-13 |
24 |
16 |
1 |
-18 |
||
| E S Central | 60 |
-29 |
7 |
3 |
1 |
-7 |
||
| W S Central | 24 |
-31 |
-5 |
23 |
13 |
0 |
||
| Mountain | 88 |
-62 |
-71 |
7 |
5 |
7 |
||
| Pacific | 17 |
-53 |
-73 |
6 |
5 |
6 |
||
| United States | 76 |
-42 |
-16 |
7 |
2 |
-2 |
||
|
Note: HDD = heating degree day; CDD = cooling degree day Source: National Oceanic and Atmospheric Administration | ||||||||
Average temperature (°F)
7-Day Mean ending Nov 10, 2016
Source: NOAA National Weather Service
Deviation between average and normal (°F)
7-Day Mean ending Nov 10, 2016
Source: NOAA National Weather Service