Record winter withdrawals create summer storage challenges
Released: June 12, 2014
On June 6, a net natural gas storage injection of 107 billion cubic feet (Bcf) brought natural gas working inventories in the contiguous United States to 1,606 Bcf. Strong injections over the past five weeks raised storage levels well above where they were on May 2, when a 74-Bcf injection ended seven consecutive weeks of storage levels that were less than 1 trillion cubic feet (Tcf). This was the longest period of time that storage remained below 1 Tcf since 2003. Although strong injections have brought storage up considerably since then, working inventories remain at an 11-year low, presenting a challenge for storage operators during the 2014 injection season (April through October) of building sufficient inventories for the upcoming winter.
EIA forecasts that over the next five months, growth in U.S. natural gas production and flat electric power sector consumption will contribute to a record Lower 48 net injection from April through October of 2,587 Bcf. However, even if these record net injections take place, inventories for the 2014-15 winter season would still be at their lowest level since 2008. This is because of low starting inventories, following a 2013-14 winter defined by record high natural gas consumption and storage withdrawals, as waves of bitterly cold weather repeatedly swept across the United States.
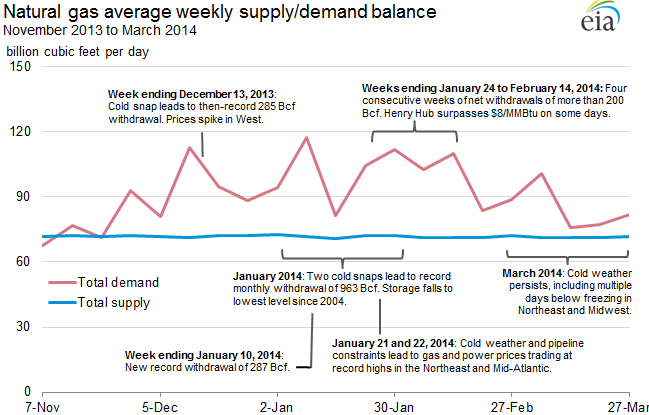
Sources: U.S. Energy Information Administration, based on data from SNL Energy, Bentek Energy LLC, and EIA's Weekly Natural Gas Storage Report and Natural Gas Monthly. Note: Supply and demand values for each date are the average of that day, and the previous six days.
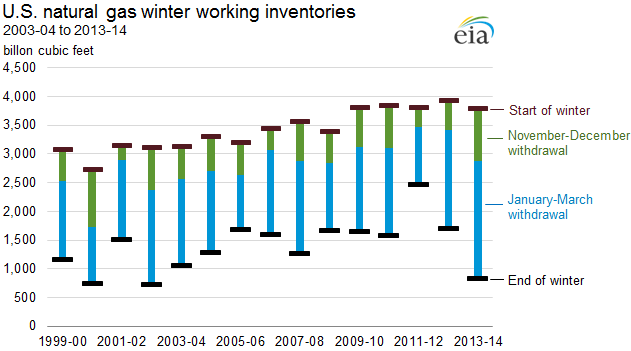
Natural gas markets in the United States began the winter season (November 2013 to March 2014) with a robust Lower 48 working gas inventory of 3,793 Bcf. Cold snaps starting in mid-November 2013 drove up demand for natural gas, particularly from residential and commercial consumers. Three consecutive months of 10-year record storage withdrawals (November 2013 through January 2014) pushed Lower 48 working inventories to their lowest January levels since 2004. Even after storage fell to a 10-year low, the cold snaps continued, pushing the Henry Hub spot price to $8.00 per million British thermal units (MMBtu) on some days in February. Sustained colder-than-normal temperatures through March pushed storage to its lowest level since 2003 and kept prices volatile, despite higher production.
Weather
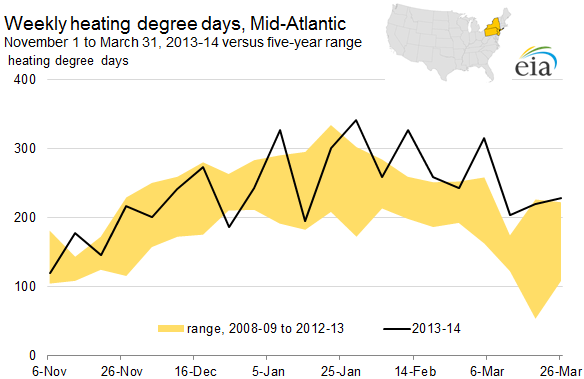
Temperatures east of the Rockies were persistently cold, record-setting as much for their sustained nature as for any single event. This cold weather was particularly persistent in the Northeast, where there were 62 days during which temperatures were below freezing this winter, versus an average of 35 days for the previous five winters (2008-09 to 2012-13). Similar weather occurred in the Midwest, where there were 100 days below freezing this winter, versus 75 during the previous five winters, and the Midcontinent producing region, where there were 57 days below freezing this winter, versus an average of 38 days for the previous five winters.
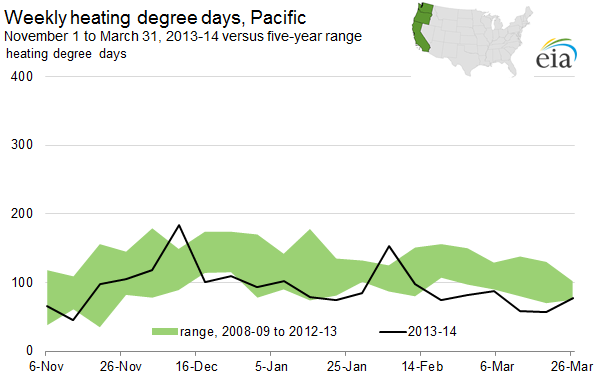
Source: U.S. Energy Information Administration, based on data from the National Oceanic and Atmospheric Administration.
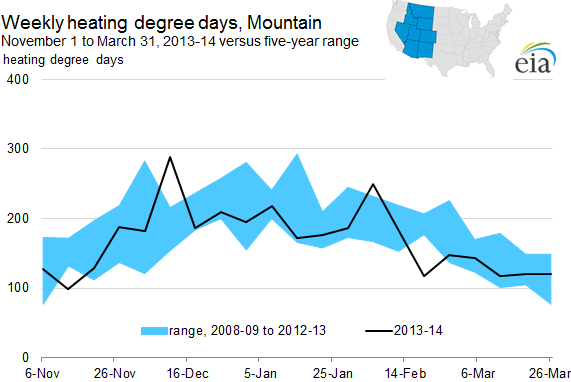
Source: U.S. Energy Information Administration, based on data from the National Oceanic and Atmospheric Administration.
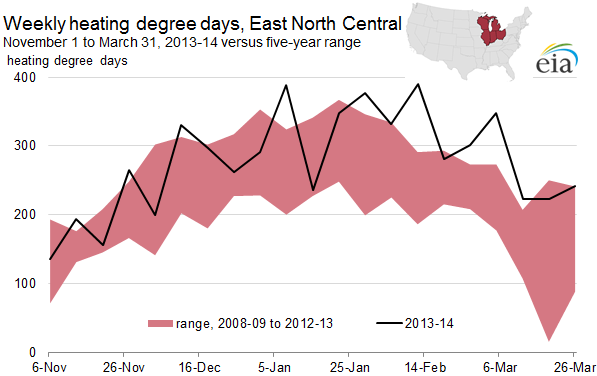
Source: U.S. Energy Information Administration, based on data from the National Oceanic and Atmospheric Administration.
Source: U.S. Energy Information Administration, based on data from the National Oceanic and Atmospheric Administration.
Bitterly cold waves swept through these three regions, as well as regions that traditionally have milder winter temperatures, like Texas, the Rockies, and the Pacific Northwest. This cold weather not only caused spikes in natural gas demand, but it also lessened the performance of the energy supply chain. Every major region of the contiguous United States experienced waves of significantly colder-than-normal temperatures:
- A cold December in the Pacific Northwest contributed to natural gas spot prices there reaching a five-year average winter high.
- On January 6, 2014, the temperature in Chicago dropped to -9 degrees Fahrenheit, 36 degrees below the average on that date from 2009 to 2013.
- On this same day, temperatures in Houston dropped 22 degrees below the five-year average.
- The next day, temperatures dropped in New Orleans, New York, and Philadelphia to 24 degrees, 25 degrees, and 29 degrees below their five-year averages, respectively.
- On January 8, temperatures in Boston dropped to 18 degrees below their five-year average.
- On February 6, temperatures in Seattle and Denver dropped to 21 degrees and 42 degrees below their five-year averages, respectively.
- Temperatures on that date were also below average in California, whose independent system operator issued an alert requesting that customers reduce electricity consumption.
Consumption
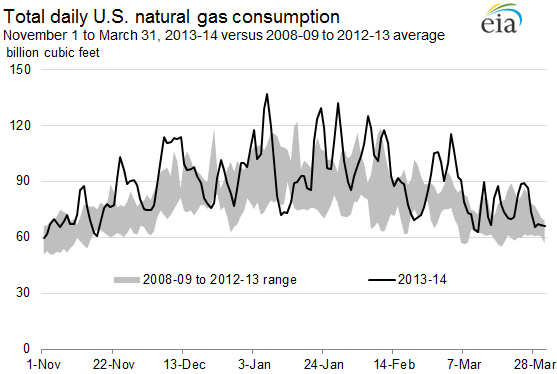
The cold weather had a dramatic effect on U.S. natural gas consumption, which rose to a record average of 91.0 billion cubic feet per day (Bcf/d) this winter. Consumption spiked during the cold weather in mid-December, early and late January, the beginning of February, and the beginning of March. U.S. natural gas consumption reached a same-month record every month from November 2013 to March 2014, according to EIA data going back to 1995. Cold weather drove consumption up by 9% over 2012-13 winter levels, with higher consumption occurring across all major sectors, despite higher prices.
Source: U.S. Energy Information Administration, based on data from Bentek Energy LLC.
Source: U.S. Energy Information Administration, based on data from Bentek Energy LLC.
Source: U.S. Energy Information Administration, based on data from Bentek Energy LLC.
Source: U.S. Energy Information Administration, based on data from Bentek Energy LLC.
Total consumption
- Total U.S. natural gas consumption surpassed the same-day maximum for the previous five winters (2008-09 to 2012-13) on 59 out of 151 days this winter, according to data from Bentek Energy LLC.
- All of the top six total natural gas consumption days going back to January 1, 2005, took place this winter, as well as seven of the top 10. Three of these seven days were at the beginning of January (January 6, 7, and 8), three were in late January (January 22, 23, and 28), and one was in early February (February 6).
- On January 7, total U.S. consumption reached an all-time record of 137.0 Bcf.
- This winter's spikes in total U.S. natural gas consumption were largely in response to weather-driven consumption from the residential and commercial sector.
- However, electric sector and industrial sector consumption also contributed to high levels of total consumption.
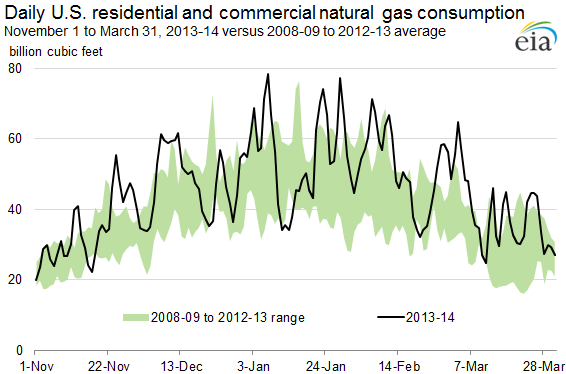
Residential/commercial sector consumption
- Residential and commercial consumers increase their demand to a greater degree in response to colder temperatures than industrial and utility consumers, and were thus affected to a greater degree by this winter's cold snaps.
- The two highest residential/commercial consumption days occurred this winter (January 7 and January 28), as well as six of the top 10 dating back to January 1, 2005.
- On January 7, residential/commercial consumption reached a record 78.3 Bcf.
- Residential and commercial consumption rose by 15% over last winter, and accounted for approximately half of total U.S. winter consumption.
- Natural gas consumption per residential household this winter averaged 66.0 million British thermal units (MMBtu), a 7% increase over both last winter's average and the average for the previous five winters. The largest increases in household consumption over last winter took place in the Midwest (10%), followed by the South (9%) and Northeast (8%).
- Average household expenditures also increased in every U.S. Census region compared to last winter, but were generally close to the average for the past five winters. This was because the average delivered price of natural gas to U.S. households was 7% lower than the average for the previous five winters.
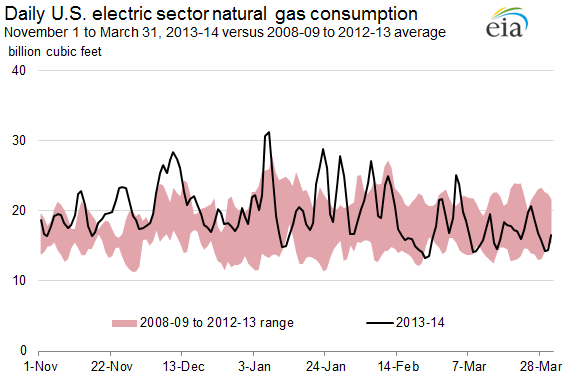
Electric power sector consumption
- Although power sector natural gas consumption grew throughout most of the United States as cold temperatures led to increased electric demand for space heating, it decreased in the Northeast and Southeast, in response to higher prices.
- States in the Northeast increasingly relied on distillate fuel oil-fired electric generation when prices spiked. During a cold period in January, oil accounted for 25% of New England's total power generation, compared to 24% from natural gas.
- States in the Appalachian region and the Southeast region increasingly relied on coal-fired electric generation to meet higher power demand.
- Electric power sector consumption rose on cold days and contributed to pushing total U.S. natural gas consumption to record-high levels this winter. However, the price sensitive nature of power sector demand, largely in the East, meant that this winter's daily power sector consumption record on January 7 of 31.2 Bcf ranked only 151st for all dates since January 1, 2005.
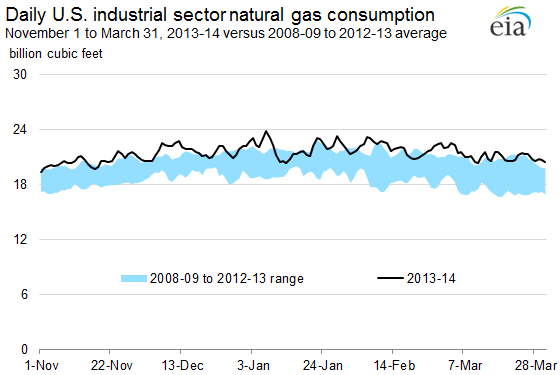
Industrial sector consumption
- Industrial consumption of natural gas rose by 6% over last winter. It has risen every winter since 2008-09.
- All of the nine days with the highest levels of industrial consumption since January 1, 2005, took place this winter. Cold temperatures contributed to spikes in industrial sector consumption, with all nine of the highest days occurring during the cold snaps at the beginning and end of January and in early February. As with the residential/commercial and electric power sectors, industrial sector consumption reached a record on January 7, of 23.8 Bcf.
- However, even on relatively warm days, industrial natural gas consumption this winter still reached same-day maximum levels when compared with the previous five winters.
- Industrial natural gas consumption has fluctuated less in response to weather than consumption in the residential/commercial and electric generation sectors. It has reflected more of a structural increase in recent years.
- This is likely the result of higher demand in response to sustained economic growth since the recession of 2008-09, and the greater amounts of natural gas that increased production has made economically available to the manufacturing and bulk chemical industries.
Supply
Natural gas dry production rose this winter by 3%, or 2.2 Bcf/d, over the 2012-13 winter, to 68.0 Bcf/d, according to EIA data. This increase was significantly greater than last winter's 0.3 Bcf/d production increase. However, it was still well below the 7.5 Bcf/d rise in total U.S. consumption that took place this winter. Higher prices provided the incentive for greater levels of production. Greater levels of natural gas output in the Marcellus Shale contributed to the net increase in national production levels despite decreases in other basins. Higher production levels from the Eagle Ford in South Texas also contributed to this winter's increase in production. These gains exceeded production declines in plays containing relatively greater amounts of drier gas, such as the Haynesville Shale in Texas and Louisiana.
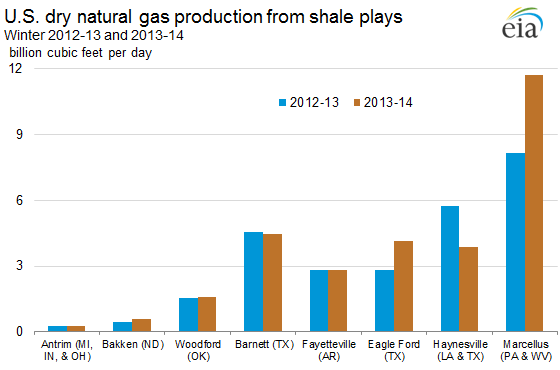
Source: U.S. Energy Information Administration calculations with data from Drillinginfo.
While total national production increased this winter, there were some daily decreases at many inland basins during periods of cold weather, including a 2.2 Bcf decrease on January 7, 2014, the eleventh largest daily decrease since January 1, 2005, according to Bentek data.
Net imports also rose this winter, by 0.7 Bcf/d over last winter's levels. Net imports from Canada into the United States increased, entirely in the Midwest and West, according to Bentek data. Net imports from Canada into the northeastern United States decreased slightly compared to last winter. Increased Marcellus production continued to reduced net inflows into the Northeast from other areas. However, net imports from Canada into the Northeast did spike during periods of high demand. Higher net imports from Canada drove up total U.S. net imports, despite a 0.3 Bcf/d decrease in net LNG imports and a slight increase in net U.S. natural gas pipeline exports to Mexico.
Storage
Natural gas markets in the United States began this winter season (November 2013 to March 2014) with relatively high levels of working gas inventories. Starting in mid-November 2013, however, U.S. natural gas consumption increased at a greater rate than supply, pushing inventories to their lowest levels since 2004, even as high prices curtailed electric sector demand in some parts of the country.
Source: U.S. Energy Information Administration, Natural Gas Monthly.
December saw record storage withdrawals in the West region, and a record 285-Bcf withdrawal in the Lower 48 states for the week ending on December 13, 2013. Lower 48 working gas inventories began January at 2,869 Bcf, and ended the month at less than 2,000 Bcf for the first time since 2005, following an overall record 967 Bcf monthly withdrawal. Heavy withdrawals continued through the first two weeks of February. Inventories, which had already reached their 10-year low by the end of January, dropped below 1,000 Bcf by the end of March for the first time since 2003. November-to-March withdrawals set records in all three storage regions, which depleted storage heading into April.
Prices
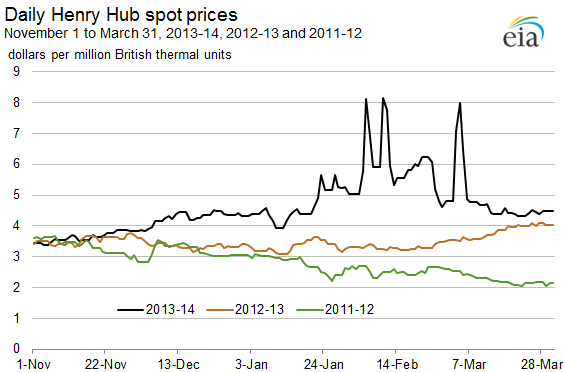
U.S. natural gas markets tightened as consumption outstripped supply and led to record-high storage withdrawals. The national benchmark spot price for natural gas traded at Henry Hub in Erath, Louisiana, averaged $4.63 per million British thermal units (MMBtu) during the 2013-14 winter, 33% higher than the winter of 2012-13, and the highest average winter spot price in four years, according to data from SNL Energy.
Source: U.S. Energy Information Administration, based on SNL Energy.
The Henry Hub spot price began last winter at less than $3.50/MMBtu, and increased to more than $5.00/MMBtu by the end of January, as inventories fell. As withdrawals continued to rise through the beginning of February, so did the Henry Hub spot price, peaking at $8.15/MMBtu on February 10, according to SNL data. Prices responded to sharp daily demand increases and continued drawdowns from storage by increasing significantly in the northeastern United States, as occurred last winter. However, these price spikes were not confined to the Northeast; they also occurred at trading hubs serving consumers in the central and western United States.
Source: U.S. Energy Information Administration, based on SNL Energy.
Source: U.S. Energy Information Administration, based on SNL Energy.
Source: U.S. Energy Information Administration, based on SNL Energy.
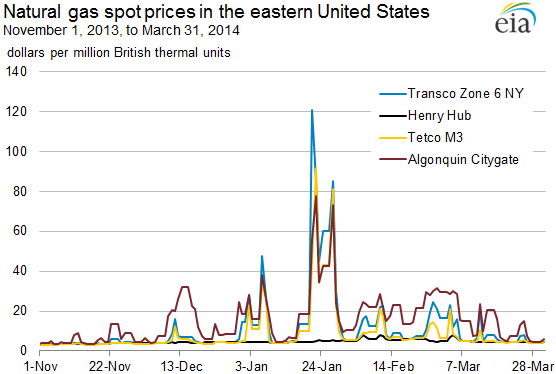
East
- As occurred last winter, natural gas spot prices spiked in the northeastern United States.
- At northeastern market hubs such as Algonquin Citygate in Boston and the Transco Zone 6-New York hub in New York City, natural gas pipeline constraints caused prices to spike during periods of high demand.
- Low storage availability and a tighter supply-demand balance this past winter exacerbated this situation, with the price in New York City reaching a record $120/MMBtu during the southward shift of the polar vortex in late January. Prices also reached record levels in New England this winter.
- Prices also rose significantly in the Mid-Atlantic region, where the Tetco-M3 (Pennsylvania) spot price rose in conjunction with price spikes farther north during late January's polar vortex incursion.
- Despite significant increases in Marcellus supply, working gas inventories in Pennsylvania fell from 369 Bcf at the end of October 2013 to 65 Bcf by the end of March 2014, their lowest level since March 1996. West Virginia working inventories also fell, to their lowest level since March 2003.
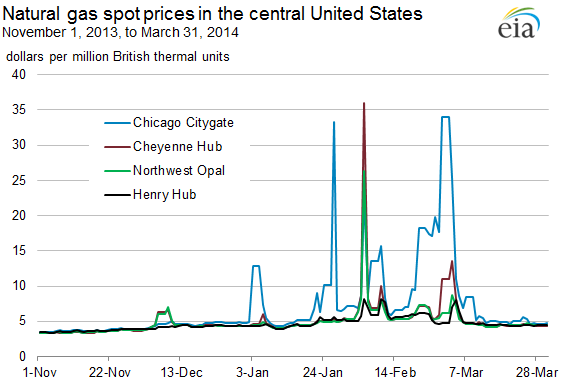
Central
- Bitterly cold temperatures in the midwestern United States caused storage to drop significantly.
- Illinois had record-low working gas inventories in January (116 Bcf), February (66 Bcf), and March (42 Bcf), compared to 253 Bcf of working gas at the end of October 2013. Working gas inventories in Michigan fell from 600 Bcf at the end of October 2013 to 56 Bcf at the end of March 2014, their lowest recorded end-March storage total. Working gas inventories in Texas, Louisiana, and Oklahoma also fell to their lowest levels since 2003.
- As a result, when unusually cold weather hit the Midwest between the end of January and the end of February, the region had to rely on increasingly expensive gas transported north from the Gulf Coast on TransCanada's ANR Pipeline and Kinder Morgan's NGPL Pipeline, as well as Alberta production brought east on TransCanada's Canadian Mainline. This reliance on more expensive Gulf production and Canadian imports caused prices to spike significantly at the Chicago Citygate, by amounts above Henry Hub that had not been seen since at least 2005.
- Inland areas farther to the southwest also saw price spikes, particularly in the Rockies, where a wave of cold weather caused prices to spike at the Opal and Cheyenne hubs in early February.
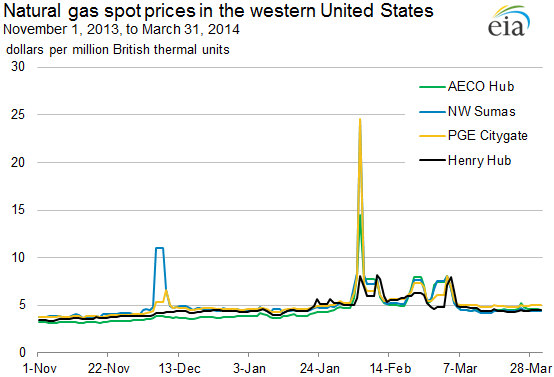
West
- Increasingly expensive supply from Alberta, combined with bitterly cold temperatures, low storage, and drops in Rockies production on cold days, led to price spikes in the West.
- The spot price from February through March surpassed $8/MMBtu at times at Niska's AECO Hub, located near the AECO storage facility in southeastern Alberta, a key trading point for western Canadian gas. This price was well above the $2/MMBtu prices at which gas traded at AECO as recently as September 2013.
- Working gas inventories in California fell from 346 Bcf at the end of October to 94 Bcf by the end of March 2014, their lowest level for that month since 2003. Inventories in Washington also reached their lowest level since 2008, while inventories in Oregon fell to their lowest level since 2005.
- As a result, prices spiked at PGE Citygate (California) and Northwest Sumas (Washington) when the West Coast was hit with a cold snap in early February. Prices also rose at Northwest Sumas when the Pacific Northwest was hit with cold weather in early December.
As Lower 48 working inventories continue to remain at an 11-year low, the focus has turned to the degree to which they rebuild in preparation for the upcoming 2014-15 winter season. Low inventories have contributed to keeping gas prices high. At the beginning of June, the Henry Hub spot price was more than $4.50/MMBtu, the first time that this occurred at this time of year since 2008. Higher prices have a number of implications for natural gas production, consumption, and storage this summer:
- EIA projects that, partially in response to higher natural gas prices, dry production will average a record 69.3 Bcf/d from April through October 2014, 4% above the same period in 2013. Natural gas net imports will also rise by 4% over last year, to 3.5 Bcf/d from April through October.
- EIA projects that natural gas power burn will increase by 1% compared to the 2013 injection season, to 24.1 Bcf/d, with April-October total consumption also increasing by 1%, to 60.8 Bcf/d.
- Warmer weather is expected to increase the number of U.S. cooling degree days (CDDs) by 6% this injection season over last year, from 177 to 187 CDDs. Total U.S. power sector generation will increase by 1%, from an average of 10.8 million megawatthours per day to 11.0 million megawatthours per day.
- However, largely because of higher natural gas prices, natural gas-fired power generation will remain flat compared to last year, while coal-fired power generation will increase by 3%. Coal-fired generation will continue to regain some of the power sector market share it lost in 2012, in keeping with a trend that began last summer.
- As higher prices lead to higher natural gas production and net imports, and flat natural gas consumption from the power sector, EIA projects that record natural gas storage injections will take place through October, raising Lower 48 working gas in storage to 3,424 Bcf. However, because end-March inventories were so low following this winter's bitter cold, this would still be the lowest end-October storage level since 2008, presenting a challenge in terms of having enough gas in storage entering the 2014-15 winter withdrawal season.