Forecast overview
- Global oil market assumptions. On June 18, the United States and Iran signed a memorandum of understanding (MOU) to end the conflict and open the Strait of Hormuz. Following the signing and increased traffic through the strait, we have raised our expectations for global oil production for the rest of this year. We now expect most crude oil production to return to near pre-conflict averages by the end of this year and for the majority of shut-in crude oil production to be back online in the first quarter of 2027 (1Q27).
- Global oil inventory. More oil production and the reestablishment of trade flows will result in less oil being taken out of inventory in the coming months than we previously forecast. We expect global oil inventories will fall by 2.2 million barrels per day (b/d) in 3Q26 compared with more than 7 million b/d in our June forecast and 5 million b/d in 2Q26. Next year, we expect that rising oil production will result in the market shifting back to the pre-conflict state of oversupply.
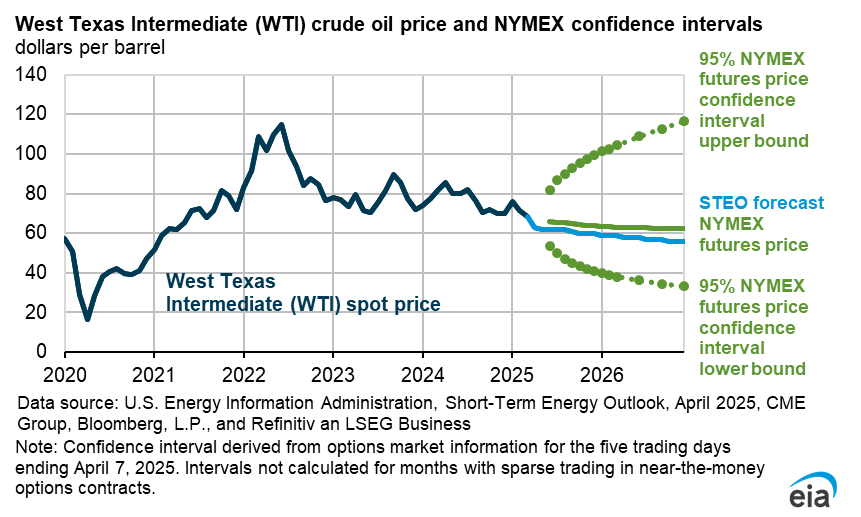
- Oil prices. Expectations of increasing oil supply and moderating inventory draws have caused oil prices to fall. The Brent crude oil spot price averaged $85 per barrel (b) in June, down $22/b from May and $32/b from its recent April 2026 peak. The Brent price in our forecast averages $74/b in 3Q26, a reduction of $27/b from last month’s outlook. We expect ongoing oil inventory accumulation over the next year will continue to put downward pressure on crude oil prices, with Brent falling to an average of $65/b in 2027.
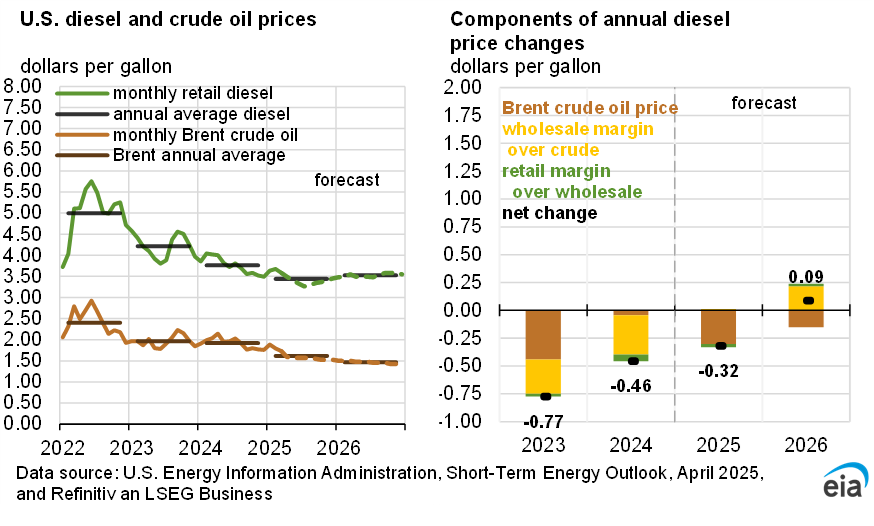
- U.S. gasoline prices. Lower crude oil prices contribute to a drop in U.S. retail gasoline prices in 3Q26 compared with 2Q26. Gasoline prices in our forecast average $3.80 per gallon (gal) in 3Q26, down from more than $4.20/gal in 2Q26. In the near-term, we expect the crude oil-driven decrease in gasoline prices will be partly offset by rising wholesale and retail margins as low gasoline inventories keep gasoline crack spreads elevated. As inventories rebuild and the summer demand season ends, crack spreads in our forecast narrow, pushing retail prices down to around $3.40/gal in 4Q26. We forecast the retail gasoline price will fall to an annual average of less than $3.10/gal in 2027.
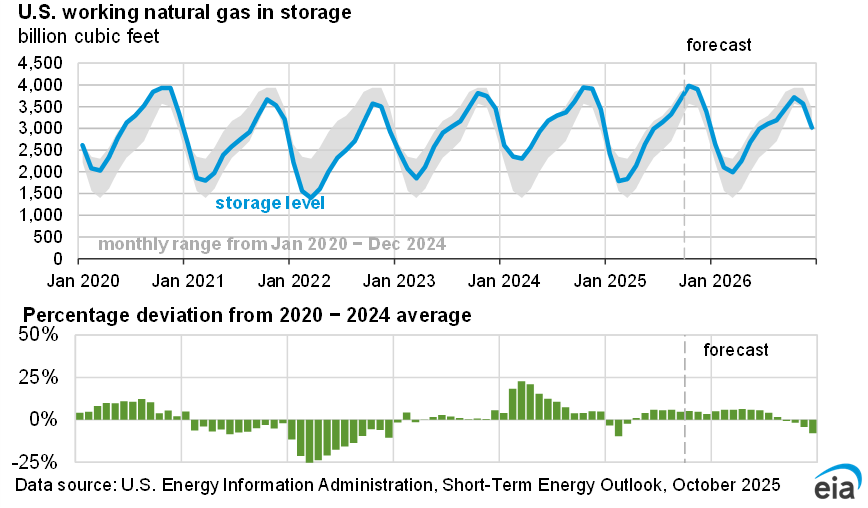
- Natural gas consumption. We expect U.S. natural gas consumption in the electric power sector will set a record next year, driven largely by rising overall electricity demand, the expansion of the natural gas generating fleet, and relatively low natural gas prices. Forecast natural gas demand across the economy rises slightly this year before increasing 3% in 2027.
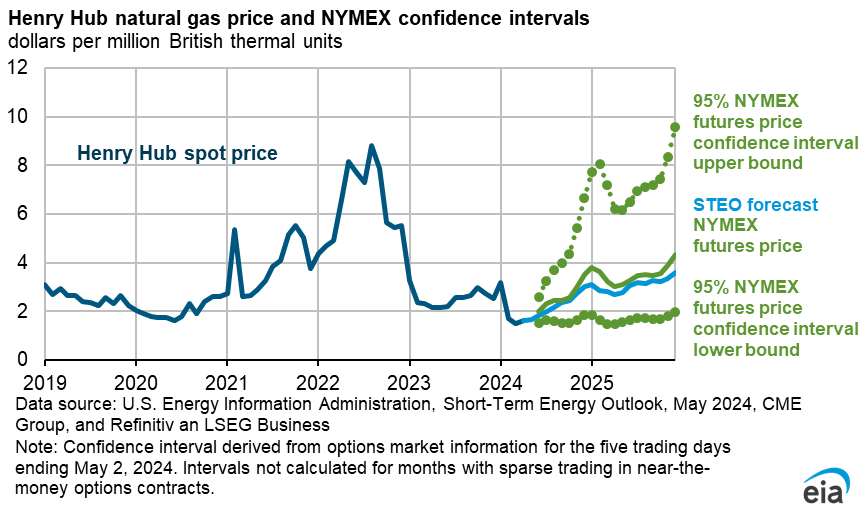
- Natural gas prices. Record U.S. natural gas production helps meet rising demand, putting moderate downward pressure on natural gas prices. The Henry Hub spot price averages close to $3.70 per million British thermal units (MMBtu) in 2026 before declining below $3.50/MMBtu next year.
- Electricity prices. We forecast that wholesale electricity prices will be lower this summer compared to last summer, primarily because of lower costs of natural gas delivered to power plants—however, heatwaves during the summer could still cause price spikes. Nationally, wholesale prices are forecast to average about $45 per megawatthour (MWh), with the largest declines occurring in the western hubs and the Midcontinent ISO region.
| Notable Forecast Changes | 2026 | 2027 |
|---|---|---|
The current STEO forecast was released July 7. |
||
| Brent crude oil spot price (dollars per barrel) | $82 | $65 |
| Previous forecast | $95 | $79 |
| Percentage change | -14% | -18% |
| OECD commercial curde oil and liquids inventories (million barrels) | 2,604 | 3,021 |
| Previous forecast | 2,269 | 2,572 |
| Percentage change | 14.8% | 17.4% |
| World oil production (million barrels per day) | 75.7 | 81.4 |
| Previous forecast | 73.2 | 80.9 |
| Percentage change | 3.5% | 0.6% |
| Retail gasoline price (million barrels) | $3.64 | $3.09 |
| Previous forecast | $3.90 | $3.64 |
| Percentage change | -6.5% | -15.1% |
You can find more information in the detailed table of forecast changes.