Solar energy is sunshine
Sunshine is radiant energy from the sun. The amount of solar radiation, or solar energy, that the earth receives each day is many times greater than the total amount of all energy that people consume each day. However, on the earth's surface, solar energy is a variable and intermittent energy source. Nevertheless, use of solar energy, especially for electricity generation, has increased significantly in the United States and around the world in the past 30 years.
Solar energy resources vary by location
The availability and intensity of solar radiation on the earth’s surface varies by time of day and location. In general, the intensity of solar radiation at any location is greatest when the sun is at its highest apparent position in the sky—at solar noon—on clear, cloudless days.
Latitude, climate, and weather patterns are major factors that affect insolation—the amount of solar radiation received on a given surface area during a specific amount of time. Locations in lower latitudes and in arid climates generally receive higher amounts of insolation than other locations. Clouds, dust, volcanic ash, and pollution in the atmosphere affect insolation levels at the surface. Buildings, trees, and mountains may shade a location during different times of the day in different months of the year. Seasonal (monthly) variations in solar resources increase with increasing distance from the earth’s equator.
The type of solar collector also determines the type of solar radiation and level of insolation that a solar collector receives. Concentrating solar collector systems, such as those used in solar thermal-electric power plants, require direct solar radiation, which is generally greater in arid regions with few cloudy days. Flat-plate solar thermal and photovoltaic (PV) collectors can use global solar radiation, which includes diffuse (scattered) and direct solar radiation.
In general, a solar energy collector with a tracking system that keeps the solar collectors oriented toward the sun will have higher levels of daily and annual insolation than a solar collector in a fixed position.
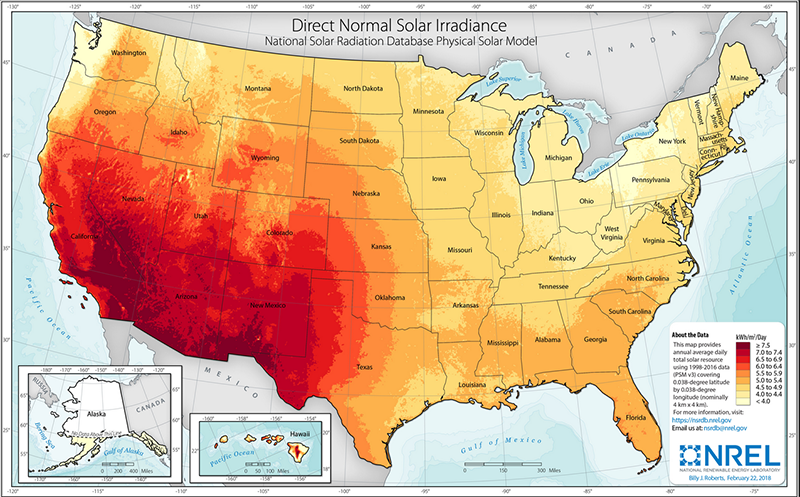
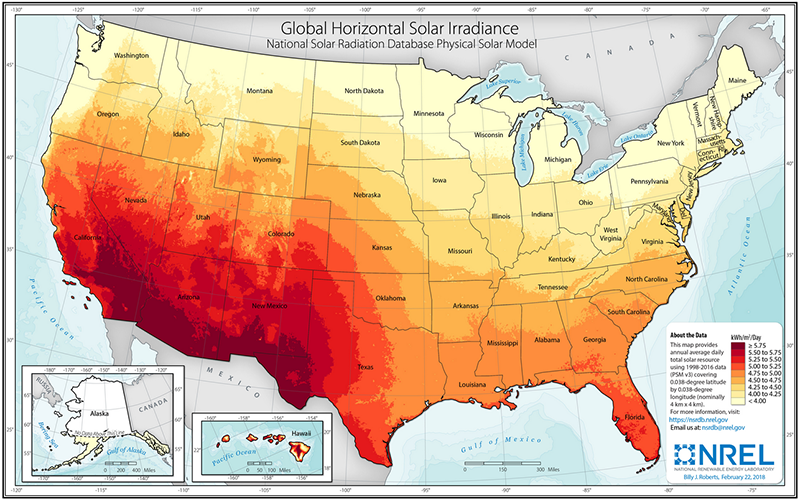
The two maps below show U.S. average annual solar radiation in kilowatthours (kWh) per square meter per day (kWh/m2/d) for direct normal irradiance (DNI) and global horizontal irradiance (GHI). The world map below shows average daily global solar radiation on a horizontal flat surface.
World map of solar resources
Source: United Nations Environment Programme (UNEP), NASA Surface meteorology and Solar Energy (SSE), 2008.
Where solar energy is used
Insolation levels are important for the technical and economic performance of solar energy systems. The availability of financial and other incentives for solar energy are major factors that influence where solar energy systems are installed. Net metering has been especially important in encouraging PV systems on homes and businesses.
Total solar energy use in the United States increased from about 0.06 trillion British thermal units (Btu) in 1984 to about 1,870 trillion Btu (or about 1.9 quadrillion Btu) in 2022. Solar electricity generation accounted for about 97% of total solar energy use in 2022 and direct use of solar energy for space and water heating accounted for about 3%.
Total U.S. solar electricity generation increased from about 5 million kWh in 1984 (nearly all from utility-scale, solar thermal-electric power plants) to about 204 billion kWh in 2022. In 2022, utility-scale PV power plants accounted for 70% of total solar electricity generation, small-scale PV systems accounted for 29%, and utility-scale solar thermal-electric power plants accounted for 1%. Utility-scale power plants have at least 1,000 kilowatts (kW) (or one megawatt [MW]) of electricity generation capacity. Small-scale PV systems have less than one MW generation capacity.
In 2022, California accounted for the largest percentage share of total utility-scale solar electricity generation at 27%, followed by Texas at 15%. California accounted for nearly 40% of total generation from small-scale PV systems. Most small-scale PV systems are installed on or near buildings. Residential sector small-scale PV systems accounted for 64% of total small-scale PV electricity generation in 2022, with California's percentage share at 40%.
According to EIA’s International Energy Statistics, total world solar electricity generation grew from 0.4 billion kWh in 1990 to about 1.306 billion (about 1.3 trillion) kWh in 2021. The top five producers of solar electricity and their percentage shares of world total solar electricity generation in 2021 were:
- China–33%
- United States–16%
- Japan–9%
- India–6%
- Germany–5%
Last updated: April 25, 2023, with most recent available data. Data for the United States for 2022 are preliminary.